Article Text

Abstract
Introduction Red cell distribution width (RDW) is associated with mortality and bloodstream infection risk in critically ill patients. We hypothesized that an increase in RDW at hospital discharge in critically ill patients who received emergency general surgery (EGS) would be associated with increased mortality after hospital discharge.
Methods We performed a two-center observational study of patients treated in medical and surgical intensive care units. We studied 1567 patients, who received critical care between 1998 and 2012 who underwent EGS and survived hospitalization. The exposure of interest was RDW within 24 hours of hospital discharge and categorized a priori in quintiles as ≤13.3%, 13.3% to 14.0%, 14.0% to 14.7%, 14.7% to 15.8%, 15.8% to 17.0% and >17.0%. The primary outcome was 90-day all-cause mortality. Adjusted ORs were estimated by multivariable logistic regression models with inclusion of covariate terms for age, race, gender, Deyo-Charlson Index, sepsis and number of organs with acute failure.
Results The cohort patients were 51.4% male and 23.2% non-white. 23.9% had sepsis and the mean age was 58 years. 90-day postdischarge mortality was 6.8%. Patients with a discharge RDW 15.8% to 17.0% or RDW >17.0% have an adjusted OR of 90-day postdischarge mortality of 3.64 (95% CI 1.04 to 12.68; p=0.043) or 4.58 (95% CI 1.32 to 15.93; p=0.02), respectively, relative to patients with a discharge RDW ≤13.3%. Further, patients with a discharge RDW ≥15.8 have an adjusted OR of 30-day hospital readmission of 2.12 (95% CI 1.17 to 3.83; p=0.013) relative to patients with a discharge RDW ≤13.3%.
Conclusions In EGS patients requiring critical care who survive hospitalization, an elevated RDW at the time of discharge is a robust predictor of all-cause patient mortality and hospital readmission after discharge.
Level of evidence Level II, prognostic retrospective study.
- emergency general surgery
- red cell distribution width
- mortality
- acute care surgery
This is an Open Access article distributed in accordance with the Creative Commons Attribution Non Commercial (CC BY-NC 4.0) license, which permits others to distribute, remix, adapt, build upon this work non-commercially, and license their derivative works on different terms, provided the original work is properly cited and the use is non-commercial. See: http://creativecommons.org/licenses/by-nc/4.0/
Statistics from Altmetric.com
Introduction
Emergency general surgery (EGS) comprises a significant burden of medical care, constituting 7.2% of total hospital admissions in the USA with an increasing incidence over time.1 Furthermore, EGS is known to lead to significant morbidity and mortality, with estimates of 12% to 15% 30-day mortality and 25% 1-year mortality.2 Although it is evident that the mortality related to EGS is not confined to the patient’s hospital stay, the risk factors for postdischarge mortality are not yet well defined. Malnutrition at intensive care unit (ICU) admission,3 increasing age and uninsured status4 have been noted to correlate with increased mortality after EGS. However, further prognostic indicators may be helpful in better stratifying EGS patients at discharge for closer follow-up to improve mortality.
A recent study by Purtle et al defined a role for red cell distribution width (RDW) as a prognostic factor for mortality after hospital discharge in ICU patients.5 RDW is a parameter that reflects the heterogeneity of erythrocyte volume, and elevated RDW has been shown to also have value in predicting mortality and adverse outcomes in multiple disease states including septic shock,6 pulmonary embolism,7 coronary artery disease8 and heart failure.9 EGS is often performed in critically ill patients and, like all trauma or surgery, leads to an inflammatory state.10 The relationship between RDW and EGS has not been previously studied.
The aim of this study was to examine the relationship between RDW and mortality in critically ill EGS patients who survive to hospital discharge. We hypothesized that RDW will predict postdischarge mortality after EGS.
Materials and methods
Source population
We extracted administrative and laboratory data from patients admitted to two Boston hospitals: Brigham and Women’s Hospital (BWH), with 777 beds, and Massachusetts General Hospital (MGH), with 999 beds. The two hospitals provide primary as well as tertiary care to an ethnically and socioeconomically diverse population within eastern Massachusetts and the surrounding region.
Data sources
Data on all patients admitted to BWH or MGH between November 2, 1997 and December 31, 2012 were obtained through the Research Patient Data Registry (RPDR), a computerized registry which serves as a central data warehouse for all inpatient and outpatient records at Partners HealthCare sites which includes BWH and MGH. The RPDR has been used for other clinical research studies.5 11-13
Study population
During the study period, there were 2697 unique patients, age ≥18 years, who received critical care, underwent EGS within 48 hours of ICU admission and were assigned a diagnosis-related group code. ICU admission was analyzed by assignment of the Current Procedural Terminology (CPT) code 99 291 (critical care, first 30–74 min) during hospitalization admission, a validated approach for ICU admission in the RPDR database.14 Exclusions included: one patient who had white cell count over 150 000/109/L, as a high white cell count may skew the automatically calculated RDW15; 885 patients who did not have RDW drawn within 24 hours of hospital discharge and 244 patients who died as inpatients. Thus, 1567 patients constituted the total study population.
Exposure of interest and comorbidities
We examined RDW within 24 hours of hospital discharge. This was categorized a priori in quintiles as ≤13.3%, 13.3% to 14.0%, 14.0% to 14.7%, 14.7% to 15.8%, 15.8% to17.0%, and >17.0%.5 13 EGS was defined as seven surgical procedures shown to encompass the majority of relevant emergency operations16 occurring within 48 hours of ICU admission. These procedures include appendectomy, cholecystectomy, lysis of peritoneal adhesions, laparotomy, partial colectomy, operative management of peptic ulcer disease, and small bowel resection. Initiation of critical care was defined as the presence of CPT code 99 291 (critical care, first 30–74 min), an approach validated in our administrative database.14 Sepsis was defined by the presence of International Classification of Diseases ninth revision (ICD-9) codes 038, 995.91, 995.92, or 785.52, from 3 days prior to initiation of critical care to 7 days after.17 We used the Deyo-Charlson Index to assess the burden of chronic illness18 using ICD-9 coding algorithms which has been previously validated.19 20 Patient type is defined as medical or surgical and incorporates the Diagnostic Related Grouping (DRG) methodology.21 The number of organs with failure was previously described by Martin et al 22 and defined by a combination of ICD-9-clinical modification and CPT codes relating to acute organ dysfunction assigned from 3 days before the initiation of critical care to 30 days after.23 24 Changes from the expected hospital length of stay (LOS) were analyzed by calculating the difference between the actual LOS and the geometric mean LOS for each DRG as analyzed by the Centers for Medicare and Medicaid Services.25
Patients were considered to have exposure to inotropes and vasopressors if they received dopamine, dobutamine, epinephrine, norepinephrine, phenylephrine, milrinone or vasopressin anytime from 3 days prior to the initiation of critical care and 7 days after. As adding exogenous red blood cells (RBCs) through repeated transfusions is reported to increase the RDW,15 transfusion data were obtained via blood bank reports.
Assessment of mortality
Information on vital status for the study cohort was obtained from the Social Security Administration Death Master File. The accuracy of the Social Security Administration Death Master File for in-hospital and out of hospital mortality in our administrative database is validated.14 Hundred percent of the cohort had vital status present at 365 days after hospital discharge.
End points
The primary outcome was all-cause 90-day postdischarge mortality. Secondary outcomes included 365-day postdischarge mortality, unplanned 30-day and 90-day hospital readmission26 27 and discharge to a care facility. Hospital readmission was analyzed from hospital admission data as previously described28 and defined as a subsequent or unscheduled admission to BWH or MGH after the index hospitalization.28-30 We excluded readmissions with DRG codes that are associated with planned readmissions in addition to DRGs for transplantation, procedures related to pregnancy, and psychiatric issues as previously described.28 31 Discharge care facility data were analyzed from hospital records.32
Power calculations and statistical analysis
Based on our prior work,5 we anticipated that absolute 90-day posthospital discharge mortality would increase 12.7% in patients with discharge RDW >15.8% compared with those with discharge RDW ≤13.3%. With an alpha error level of 5% and a power of 90%, the sample size thus required for our primary end point (90-day posthospital discharge mortality) was 114 in the RDW >15.8% group and 114 in the RDW ≤13.3% group.
Categorical variables were described by frequency distribution and compared across RDW groups using contingency tables and Χ2 testing. Continuous variables were compared across exposure groups using one-way analysis of variance. Unadjusted associations between covariates and mortality were estimated by bivariable logistic regression models. Adjusted ORs were estimated by multivariable logistic regression models with inclusion of covariate terms thought to plausibly be associated with both RDW levels and 90-day postdischarge mortality. Overall fit of the models was assessed using the Hosmer-Lemeshow test and the Bayesian information criterion.
We evaluated the possible effect modification of sepsis, hospital, acute kidney injury, year of hospitalization or total number of packed RBC (PRBC) units transfused on the risk of mortality using the likelihood-ratio test. We evaluated for confounding by running the adjusted model with and without terms for calendar quarter of hospital discharge and LOS. We calculated receiver operator characteristic curves to analyze the discriminating power of discharge RDW for predicting 90-day postdischarge mortality. The coefplot command was used to graphically represent the continuous relationship between discharge RDW level and risk of 90-day postdischarge mortality.33 Locally weighted scatter plot smoothing (LOWESS)34 35 was used to demonstrate the relationship between change in RDW and hospital LOS. We evaluated the difference in discrimnation between discharge RDW and LOS via the DeLong method.36
Mixed-effect logistic regression models37 38 using both fixed and random-effects were used to evaluate the association between changes in RDW and 90-day postdischarge mortality using the STATA xtmelogit command39 with the dates of RDW for the individual patients as the random effect. We assessed the following variables for confounding: age, race, gender, Deyo-Charlson Index, sepsis and number of organs with acute failure. The model used a fixed effect for age, race, gender, Deyo-Charlson Index, sepsis and number of organs with acute failure; an independent covariance structure of the random effects and Gaussian-distributed random intercepts and slopes. We used negative binomial regression (overdispersed Poisson regression) models to describe how changes in RDW varied with hospital LOS. All p values are two-tailed, with values <0.05 were considered statistically significant. All analyses were performed using STATA V.14.1MP statistical software.
Results
Patient characteristics of the study cohort were stratified according to 90-day postdischarge mortality (table 1). In the study cohort, the mean (SD) age at hospital admission was 58.3 (18.8) years. Most patients were male (51%) and white (77%). The median (IQR) change in RDW from hospital admission to hospital discharge was 0.4% (−0.1%–1.3%). The median (IQR) LOS was 12 (7–21) days and the median (IQR) for total transfused RBCs was 0 (0, 6) units. Cohort patients (42.1%) received at least 1 PRBC unit during hospitalization and before discharge RDW was analyzed. In those who received at least 1 PRBC unit, the median (IQR) for total transfused RBCs was 8 (4–17) units. The number of red cell transfusions decreased during the time of the study (Kruskal-Wallis equality-of-populations rank test p=0.031).
Characteristics and unadjusted association of potential prognostic determinants with 90-day post discharge mortality*
In the study cohort, the 90-day and 365-day postdischarge mortality rates were 6.8% and 16.0%, respectively. Age, race, Deyo-Charlson index, RDW at hospital admission, acute organ failures, malignancy, sepsis, LOS, changes in expected LOS and RDW at hospital discharge were significantly associated with 90-day postdischarge mortality (table 1). Patient characteristics of the study cohort were stratified according to discharge RDW levels (table 2). Factors that differed with RDW categories included age, gender, Deyo-Charlson index, acute organ failures, malignancy, sepsis, LOS, changes in expected LOS and the mortality, readmission and discharge to facility outcomes (table 2).
Patient characteristics by RDW category group hospital discharge RDW
Primary outcome
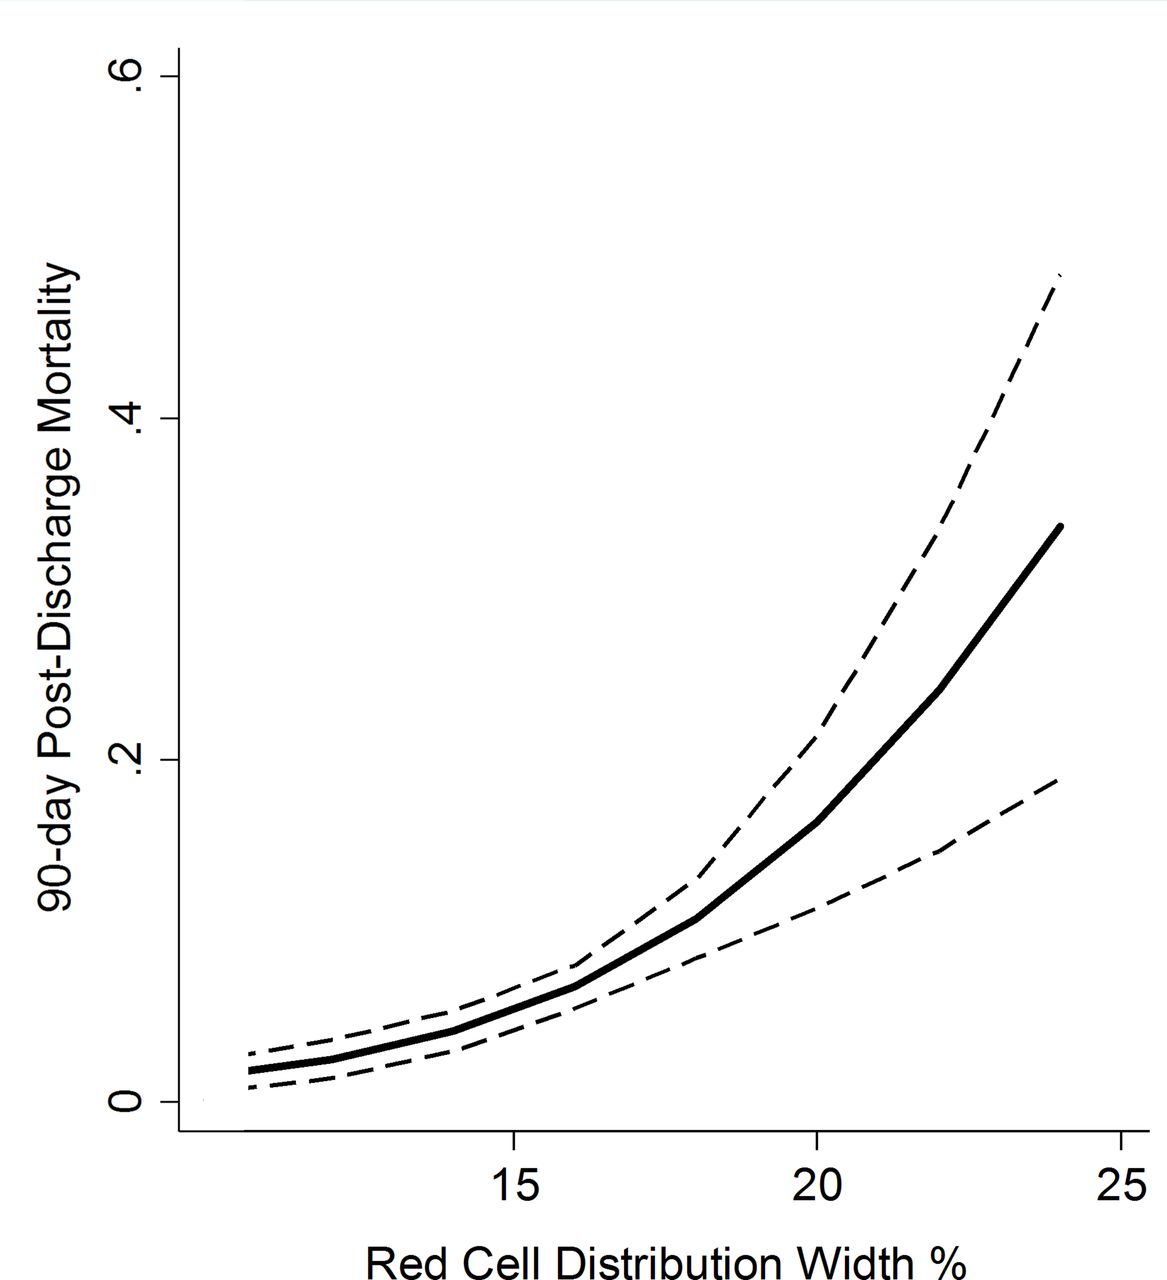
Discharge RDW was a strong predictor of mortality (figure 1 and table 3). The odds of 90-day mortality in the discharge RDW 15.8% to 17.0% and RDW >17.0% groups was 6.9-fold and 7.9-fold, respectively, that of those with RDW ≤13.3%. Discharge RDW remained a significant predictor of odds of mortality after adjustment for age, race, gender, Deyo-Charlson Index, sepsis and number of organs with acute failure. The adjusted odds of 90-day mortality in the discharge RDW 15.8% to 17.0% and RDW >17.0% groups was 3.6-fold and 4.6-fold, respectively, that of those with RDW ≤13.3% (table 3). The area under the curve (AUC) for the prediction model for 90-day postdischarge mortality was 0.77. The prediction model showed good calibration (Hosmer-Lemeshow χ2 7.4, p=0.49). There was no significant effect modification of the RDW 90-day postdischarge mortality association on the basis of sepsis (p-interaction=0.55), hospital (p-interaction=0.24), acute kidney injury (p-interaction=0.29), year of hospitalization (p-interaction=0.11) or total number of PRBC units transfused (p-interaction=0.85). Additional adjustment of the model for calendar quarter of hospital discharge or LOS did not materially alter the point estimates. Similar robust crude and adjusted discharge RDW-mortality associations are present at 365 days after hospital discharge (data not shown).

Regression coefficient plot representing multivariate estimates of the hospital discharge red cell distribution width 90-day postdischarge mortality association with 95% CIls (dashes). Multivariate estimates adjusted for age, race, gender, Deyo-Charlson Index, sepsis and number of organs with acute failure.
Unadjusted and adjusted associations between RDW category and 90-day postdischarge mortality (n=1567)
We next evaluated the potential correlation between red cell transfusion and increase in RDW in our cohort. A Pearson’s product–moment correlation was run to assess the relationship between number of transfused RBC units during hospitalization and the change in RDW from hospital admission to hospital discharge in the cohort (n=1567). There was a very weak positive correlation between number of transfused PRBC units and change in RDW (r=0.08, p=0.0145) with the number of transfused PRBC units explaining only 0.06% of the variation in RDW.
Further, to evaluate the association of the change in RDW during hospitalization and 90-day postdischarge mortality, we studied measures of RDW at hospital admission and at hospital discharge. In a mixed-effect logistic regression model adjusted for age, race, gender, Deyo-Charlson Index, sepsis and number of organs with acute failure, the adjusted odds of 90-day postdischarge mortality is 0.93 (95% CI 0.82 to 1.07) for each 1% increase in RDW during hospitalization (p=0.316) compared with the 90-day postdischarge mortality in the entire cohort. Thus, in our cohort, the change in RDW is not associated with change in adverse outcome after hospital discharge.
We next evaluated discharge RDW stratified by RDW at ICU admission due to our prior findings that RDW at ICU admission is associated with mortality.13 The data show that the discharge RDW-90-day postdischarge mortality association is preserved after censoring for elevated RDW >17.0% at ICU admission (n=1385). The adjusted ORs of 90-day mortality in the discharge RDW 15.8% to 17.0% and RDW >17.0% groups was 3.5 (95% CI 0.99 to 12.21) and 3.7 (95% CI 1.02 to 13.14), respectively, that of those with RDW ≤13.3%.
Secondary outcome
The odds of 30-day readmission in the discharge RDW 15.8% to 17.0% and RDW >17.0% groups was 3.3-fold and 2.8-fold, respectively, that of those with RDW ≤13.3% (table 4). Discharge RDW remained a significant predictor of odds of readmission after adjustment for age, race, gender, Deyo-Charlson Index, sepsis and number of organs with acute failure. The adjusted odds of 30-day readmission in the discharge RDW 15.8% to 17.0% and RDW >17.0% groups was 2.3-fold and 1.9-fold, respectively, that of those with RDW ≤13.3% (table 4). Similar robust crude and adjusted discharge RDW readmission associations are present at 90 days after hospital discharge. Further, robust crude and adjusted associations between discharge RDW group and discharge facility are present (table 4).
Unadjusted and adjusted associations between red blood distribution width (RDW) category, discharge to facility and hospital readmission (n=1567)
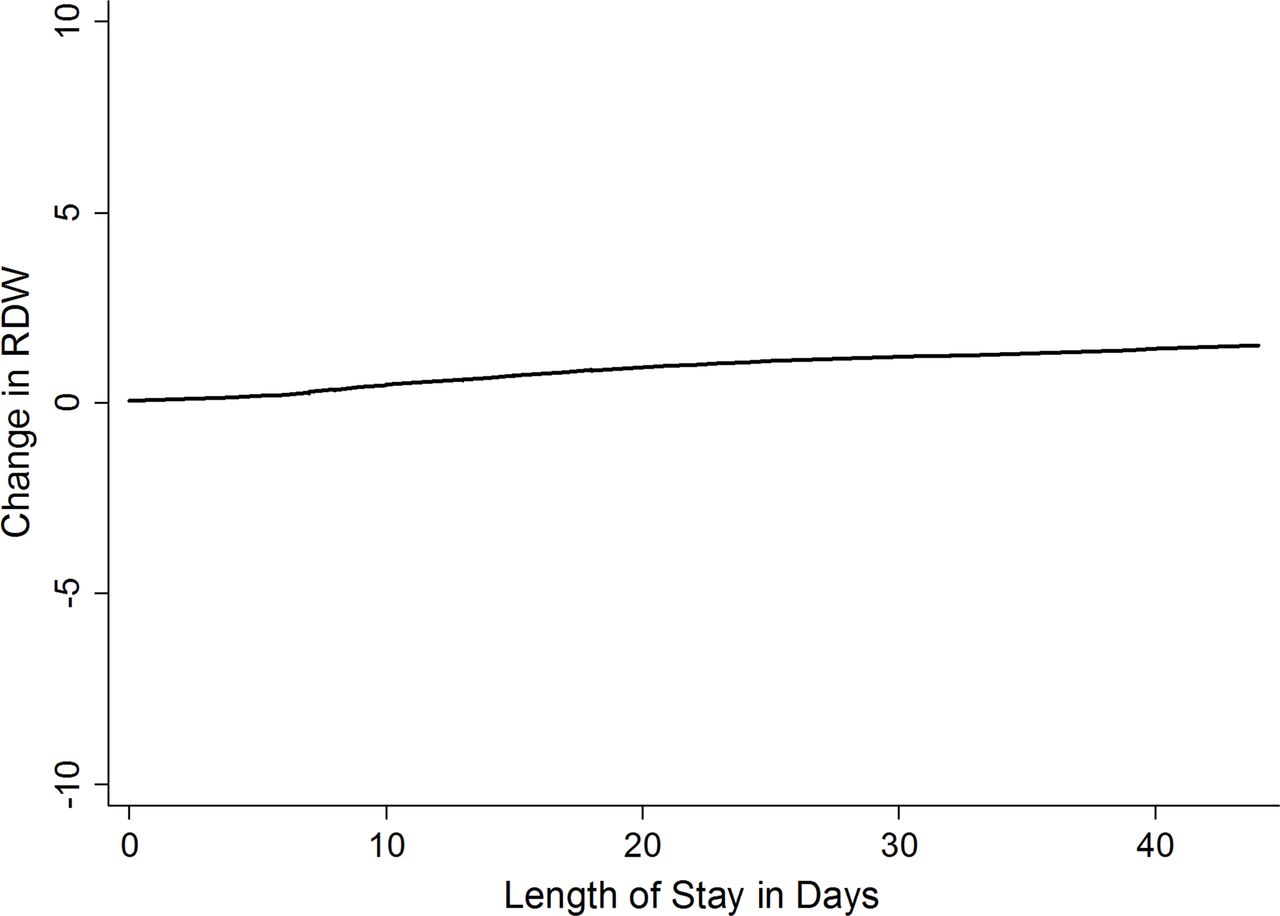
Finally, we explored the relationship between RDW and LOS. In a negative binomial regression adjusted for age, race, gender, Deyo-Charlson Index, sepsis and number of organs with acute failure, we find that for every 1-day increase in LOS, the change of RDW increases by 0.2% (incident rate ratio (IRR) 1.002 (95% CI 1.001 to 1.003)) (figure 2). LOS was next compared with discharge RDW as an exposure in models adjusted by age, gender, race, Deyo-Charson index, acute organ failures and sepsis with 90-day postdischarge mortality as the outcome. The discriminatory ability of LOS for 90-day postdischarge mortality as quantified using the c-statistic (AUC=0.729) was less than that of discharge RDW (AUC=0.765) with the difference being significant (χ2(1)=6.80, p=0.0091). This indicates that discharge RDW has significantly superior discrimination than LOS for 90-day postdischarge mortality.

Change in red cell distribution width (RDW) versus length of stay. Locally weighted scatter plot smoothing used to represent the association between the length of stay and change in RDW.
Discussion
EGS has been shown to confer significant morbidity and mortality, not only during the patient’s hospital stay but also after discharge.1 2 Therefore, the discovery of predictive factors to stratify EGS patients to better identify those who would benefit from closer follow-up may help prevent adverse outcomes.
There is no current gold standard predictor for mortality after discharge in EGS patients. Our group has identified that patients who are malnourished at the time of ICU admission after EGS have increased 90-day mortality.3 Although this is a helpful metric that could potentially change management both when in the hospital and in outpatient care, this requires an in-depth evaluation and often the expertise of a dietician. Although increasing age and uninsured status have been found to be correlated with worse outcomes after EGS, these are less specific metrics to use for stratification of patients postdischarge for more intensive follow-up.4 Therefore, we investigated the potential of RDW as a more specific, one-time laboratory value for use as a prognostic marker for postdischarge mortality.
RDW is a laboratory value that is commonly obtained in postsurgical patients that has prognostic value in multiple disease states. RDW is a precise quantitation of RBC heterogeneity available on virtually all automated hematology analyzers and included in the complete blood count. RDW is a reflection of subtle changes in the red cell volume (mean corpuscular volume (MCV)) and size (anisocytosis). RDW is calculated as the variation in the distribution of RBC volumes divided by the MCV. Specifically, the RDW-CV is calculated from the width of the RBC histogram at 1 SD from the mean divided by MCV×100 and reported as a percentage. The normal RDW-CV is 11.5% to 14.5%. Variation in size of RBCs (anisocytosis) with a normal MCV occurs in subclinical deficiency of iron, folate or B12, as well as Sickle cell disease, and myelodysplastic syndrome.
An elevated RDW after RBC transfusion reflects the heterogeneity in size of the transfused donor and the recipient RBC populations.40 Packed RBCs have MCV values in the normal range even during 42 days of storage.41 After the first 24 hours after transfusion, RBCs commonly survive 90 days.42 Patients with RBC transfusions can have increases in the RDW if the MCV of the donor and recipient cells are different. Patients with a normal MCV and no anisocytosis should not have an increase in RDW after RBC transfusion as the MCV of transfused cells is normal.
An elevated RDW is indicative of impaired erythropoesis. Therefore, it is a secondary marker of inflammation, malnutrition, or impaired renal function, as inadequate production of erythropoietin can lead to elevated RDW.43 As such, this marker has generated interest as a biomarker for cardiovascular conditions including coronary artery disease, peripheral vascular disease, and stroke.8 9 44 Furthermore, elevated RDW at the onset of critical care has been linked to an increased risk of 30-day mortality, and elevated RDW at discharge after critical illness has been shown to be correlated with increased mortality 30 days after discharge.5 13 Therefore, as EGS often involves a combination of critical illness, malnutrition, and inflammation, RDW is a logical potential biomarker to help predict postdischarge mortality in this cohort.
Our study demonstrates that those patients in the two highest quintiles of RDW values had a significantly increased odds of 90-day mortality, 6.9-fold and 7.9-fold of those in the lowest quintile. This remained a significant predictor of mortality after adjustment for age, race, gender, Deyo-Charlson Index, sepsis and number of organs with acute failure. Moreover, those patients in the top two quintiles of RDW had a significantly increased risk of 30-day readmission as compared with those in the lowest quartile. This shows a clear correlation between elevated RDW in the EGS patient cohort and increased postdischarge morbidity and mortality. Although it is unclear as to the direct mechanism of this correlation, it is likely that RDW is a bellwether for ongoing inflammation and malnutrition in these patients that leads to worse outcomes. The benefit of using this particular metric is that it requires a single lab draw at discharge that is likely being performed for other reasons in these patients. Therefore, it is a quick and easily interpretable value that can change the patient’s postdischarge follow-up to flag complications early and prevent increased mortality.
This study has several methodological strengths that include the use of a previously validated approaches to the definition of EGS,16 comorbidities,18-20 acute organ failure22 and sepsis.17 Additionally, all-cause mortality was analyzed using a validated method based on the Social Security Administration Death Master File, allowing for the determination of patients survival status after hospital discharge.14 We have sufficient power to detect a clinically relevant difference in 90-day postdischarge mortality. All cohort patients under study had vital status follow-up for at least 365 days.
The limitations of this study must also be considered. As with all observational studies, these data may be limited by potential confounding, reverse causation and the lack of randomly distributed exposure. Despite adjustment for multipe potential confounders, it is possible that residual confounding contributed to adverse outcomes in our cohort. Due to study design, our ability to make causal inference is limited. Finally, although we adjusted for a severity of illness score that has similar perfomance to Acute Physiology and Chronic Health Evaluation II score,45 we were unable to directly adjust for physiologic-based severity of illness scores which are strong predictors of critical illness outcome.46
In summary, RDW is an easily interpretable, cost-effective metric that can help predict postdischarge mortality in patients who undergo EGS. This biomarker can be used to stratify patients to identify those high-risk patients who may benefit from closer follow-up to avoid further morbidity and mortality after discharge. Further studies are required to better delineate the underlying mechanism of this correlation and the clinical impact of using this metric in practice. Furthermore, the mechanism of this correlation is particularly important to analyze whether this is a clinically modifiable factor which could have therapeutic value in addition to prognostic value.
Acknowledgments
This article is dedicated to the memory of our dear friend and colleague Nathan Edward Hellman, MD, PhD. The authors thank Shawn Murphy and Henry Chueh and the Partners HealthCare Research Patient Data Registry group for facilitating use of their database.
References
Footnotes
Contributors JMH, AS and KBC contributed equally to the conception and design. JMH, AJS and KBC contributed equally to the acquisition, analysis and interpretation of data. All authors drafted and critically revised the manuscript and read and given final approval for the manuscript.
Funding The authors have not declared a specific grant for this research from any funding agency in the public, commercial or not-for-profit sectors.
Competing interests None declared.
Patient consent Not required.
Ethics approval Partners Human Research Committee Institutional Review Board.
Provenance and peer review Not commissioned; externally peer reviewed.