Article Text

Abstract
Background Commonly used biochemical indicators and hemodynamic and physiologic parameters of sepsis vary with regard to their sensitivity and specificity to the diagnosis. The aim of this preliminary study was to evaluate non-invasive impedance cardiography as a monitoring tool of the hemodynamic status of patients with sepsis throughout their initial volume resuscitation to explore the possibility of identifying additional measurements to be used in the future treatment of sepsis.
Methods Nine patients who presented to the emergency room and received a surgical consultation during a 3-month period in 2016, meeting the clinical criteria of sepsis defined by systemic inflammatory response syndrome in the 2012 Surviving Sepsis Campaign Guidelines, were included in this study. We applied cardiac impedance monitors to each patient’s anterior chest and neck and obtained baseline recordings. Measurements were taken at activation of the sepsis alert and 1 hour after fluid resuscitation with 2 L of intravenous crystalloid solution.
Results Nine patients met the inclusion criteria. The mean age was 60±17 years and two were female; eight were febrile, five were hypotensive, four were tachycardic, seven were treated for infection, and six had positive blood cultures. Hemodynamic parameters at presentation and 1 hour after fluid resuscitation were heart rate (beats per minute) (97±13 and 93±18; p=0.23), mean arterial pressure (mm Hg) (81±13 and 85±14; p=0.55), systemic vascular resistance (dyne-s/cm−5) (861±162 and 1087±272; p=0.04), afterload measured as systemic vascular resistance index (dyne-s/cm−5/m2) (1813±278 and 2283±497; p=0.04), and left cardiac work index (kg*m/m2) (3.6±1.4 and 3.3±1.3; p=0.69).
Discussion Through measuring a patient’s systemic vascular resistance and systemic vascular resistance index (afterload), statistical significance is achieved after intervention with a 2 L crystalloid bolus. This suggests that, along with clinical presentation and biochemical markers, impedance cardiography may show utility in providing supporting hemodynamic data to trend resuscitative efforts in patients with sepsis.
Level of evidence Level IV.
This is an open access article distributed in accordance with the Creative Commons Attribution Non Commercial (CC BY-NC 4.0) license, which permits others to distribute, remix, adapt, build upon this work non-commercially, and license their derivative works on different terms, provided the original work is properly cited, appropriate credit is given, any changes made indicated, and the use is non-commercial. See: http://creativecommons.org/licenses/by-nc/4.0/.
Statistics from Altmetric.com
Introduction
One of the core messages of the Surviving Sepsis Campaign is that to treat sepsis, physicians must first promptly identify sepsis.1 This can be challenging. The systemic inflammatory response syndrome (SIRS) criteria are broad and non-specific, and biochemical markers require time to result. There is a general consensus that sepsis is a hyperdynamic state relating to increased cardiac output and decreased systemic vascular resistance (SVR).1 Adjunct studies can identify patients with an increased cardiac output and decreased SVR, and prove valuable in the early diagnosis of sepsis. Invasive Swan Ganz monitoring can provide accurate information regarding cardiac output and SVR, but wide use for the diagnosis of sepsis is impractical, antiquated, and dangerous. An alternative to Swan Ganz catheterization is impedance cardiography.
Impedance cardiography was initially conceived in the 1940s by Jan Nyboer, who described the process of calculating blood volume using the resistance of blood in the thorax with electrical impedance.2 3 In the 1960s, the National Aeronautics and Space Administration funded Kubicek et al2 to develop a high-frequency, low-amplitude current to be applied to the chest using electrodes, and capturing that signal with additional electrodes capable of measuring impedance to flow of that current. This provided an indication of the quantity of blood ejected into the aorta (stroke volume) based on the wave form produced by voltage capture between systole and diastole.4
Compared with muscle, lung, fat, skin, bone, and air, blood has the lowest measurable electrical resistivity and the highest conductivity and permittivity.5 Since an electrical current takes the path of least resistance, movement of a current applied to the thorax will mirror that of the path of blood flow.5 6 The measurement of electrical resistance, or impedance, in the chest throughout the cardiac cycle generates a wave form (Z) based on the path of electrical vectors. Taking the derivative of the Z wave over ventricular ejection time will generate a change in blood volume flowing through the chest, which is the stroke volume.7 From stroke volume, cardiac output can be extrapolated using the patient’s heart rate, or more simply by measuring the stroke volume during the course of 1 minute, creating a more accurate measurement of minute to minute cardiac output, given that the stroke volume multiplied by an instantaneous heart rate, which can vary between 70 and 100 beats per minute (bpm) on telemetry monitors in a critically ill patient, will also vary. Similarly, various other hemodynamic parameters can be calculated or estimated from the impedance wave form, including contractility index, stroke volume index, heart rate, cardiac index, systolic blood pressure, diastolic blood pressure, mean arterial pressure, ventricular ejection time, early diastolic filling ratio, left cardiac work index (LCWi), systemic vascular resistance index (SVRi), end diastolic volume, and ejection fraction.8 9
The aim of the study was to evaluate the use of non-invasive impedance cardiography to identify additional measurements to be used in the future treatment of sepsis. Its non-invasive approach to obtaining useful hemodynamic variables is appealing for many reasons. In doing so, it may affect the prospective administration of care in critically ill patients.
Methods
In our 665-bed independent academic medical center, patients meeting the criteria for severe sepsis alerts, based on the SIRS criteria of the Surviving Sepsis Campaign Guidelines of 2012 (table 1), are paged to the surgical emergency service. Nine consecutive patients meeting the criteria for severe sepsis alert were monitored with the PhysioFlow system, a modern platform of impedance cardiography. These patients presented with signs and symptoms to suggest to the presiding emergency medicine attending physician that they had a surgical (i.e., potentially actionable) source of their sepsis. This study was performed during the course of a 3-month period while the PhysioFlow device was on loan from Manatec Biomedical. Impedance electrodes were placed on the anterior chest and neck of each patient in the device’s configured arrangement. Measurements were taken at the time of arrival (T0) and 1 hour after 2 L intravenous crystalloid solution bolus (T1) while in the emergency room. Measurements were used for observation only, and no medical treatment was performed from the data obtained.
Severe sepsis alert criteria*
LCWi is a surrogate for the energy transfer required to perform cardiac output per body surface area measured in kg*m/m2. Additionally, SVRi is a measurement of afterload, whereby the resistance to blood flow is applied across a patient’s body surface area. Plotting SVRi against LCWi graphically creates a hemodynamic cross for convenient analysis of a patient with various hemodynamic derangements. This is an added benefit of cardiac impedance used in this study.
Results
The mean age of all patients included in this study was 60±17 years. Two were female. Eight were treated for infection (two urosepsis, one liver abscess, two pneumonia, and three soft tissue infection) (table 2). Of those with an infection diagnosis, six had positive cultures. One patient meeting the severe sepsis alert criteria had an alternative final diagnosis of sulfa-induced hepatitis. Patients with a diagnosis of urosepsis, liver abscess, and non-infectious etiology were free of medical comorbidities. Alternatively, patients with a diagnosis of pneumonia and soft tissue infection had multiple medical comorbidities, including coronary artery disease, diabetes, chronic kidney disease, and so on. Hemodynamic parameters at presentation and 1 hour after fluid resuscitation were heart rate (bpm) (97±14 and 93±18; p=0.23), mean arterial pressure (mm Hg) (81±13 and 85±14; p=0.55), SVR (dyne-s/cm−5) (861±162 and 1087±272; p=0.04), afterload measured as SVRi (dyne*s/cm−5/m2) (1813±278 and 2283±497; p=0.04), and LCWi (kg*m/m2) (3.6±1.4 and 3.3±1.2; p=0.69) (table 3).
Patient demographics at presentation and their respective SVRi/LCWi at T0 and T1
Hemodynamic parameters at time T0 and T1
Discussion
The most striking feature of the T0 and T1 measurements came from the SVR and SVRi parameters. Where the T0 mean for SVR was 861 dyn*s/cm5, the T1 mean was 1087 dyn*s/cm5, showing a net improvement of 226 dyn*s/cm5 after 2 L crystalloid bolus (p=0.0468). For SVRi, the T0 mean was 1813 dyn*s/cm5*m2, whereas the T1 mean was 2283 dyn*s/cm5*m2 after fluid resuscitation, showing a net difference of 470 dyn*s/cm5*m2 (p=0.0466). LCWi T0 and T1 means were 3.61 kg*m/m2 and 3.34 kg*m/m2, showing a difference of 0.27 kg*m/m2 after initial resuscitation. Less significantly, mean arterial pressure at T0 and T1 was 81 mm Hg and 85 mm Hg (p=0.55), ejection fraction at T0 and T1 was 55% and 51% (p=0.28; Pearson correlation coefficient 0.38), and ventricular ejection time at T0 and T1 was 273 ms and 259 ms (p=0.42; Pearson correlation coefficient 0.39).
Impedance cardiography has shown a significant linkage between blood pressure and SVR.10 As SVR increases, blood pressure similarly increases. Given that volume is an important component of blood pressure, it follows logically that volume is an important component of SVR. This is supported by the noted increases in SVR and SVRi observed after fluid challenge in the current investigation (table 3).
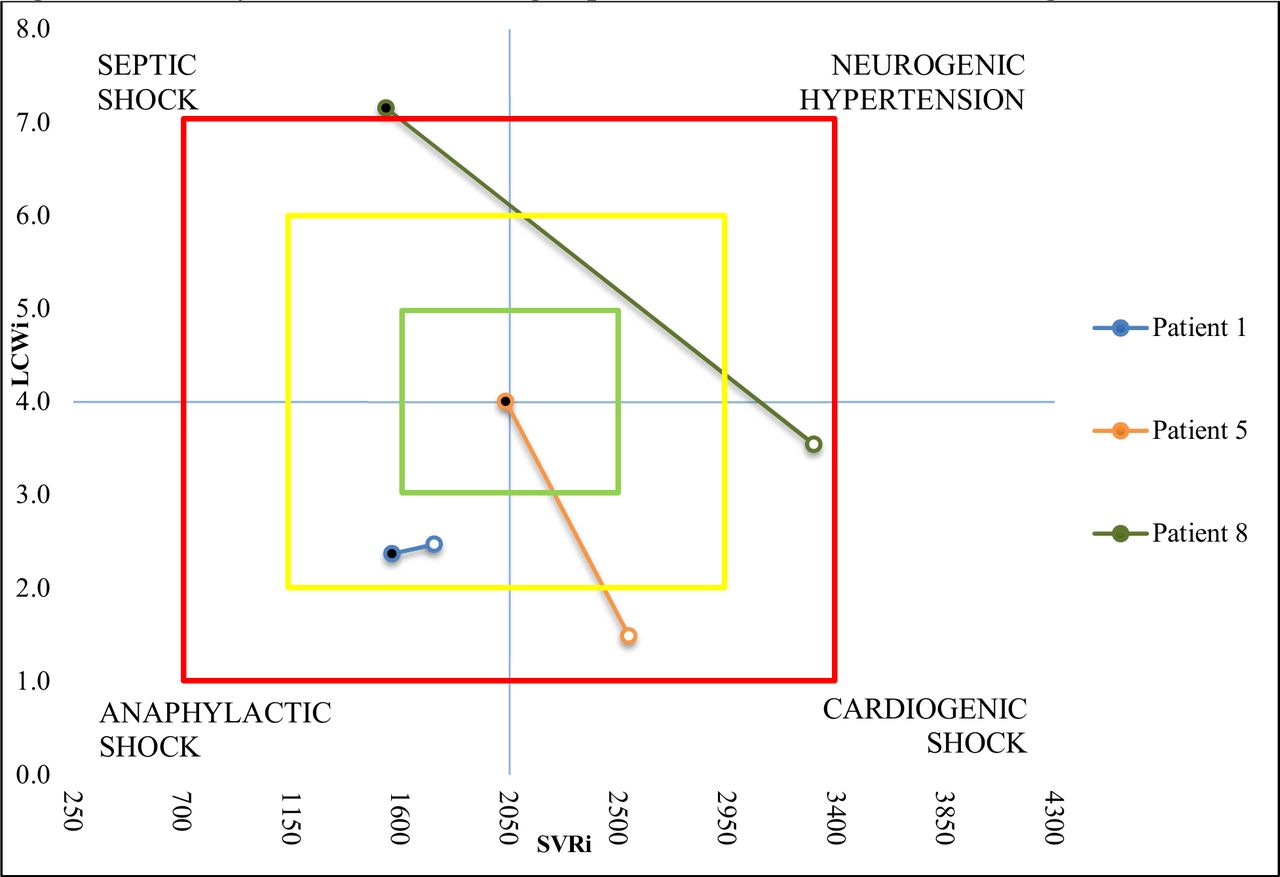
In patients free of medical comorbidities, the recordings fell into the appropriate quadrant of the hemodynamic cross (LCWi vs. SVRi). Patients with urosepsis had data points within the septic shock territory of the cross (figure 1). The patient with a liver abscess had similar findings. Patients presenting with medical comorbidities had variable data. Patients with pneumonia never had any recordings within the sepsis region of the cross, although they did exhibit appropriate SVR/SVRi changes after crystalloid bolus (figure 2). Patients with soft tissue infection had various starting points, but two patients resulted with hemodynamic readings within the cardiogenic shock quadrant after fluid bolus (figure 3). This finding may suggest volume overload in the setting of acute heart failure.
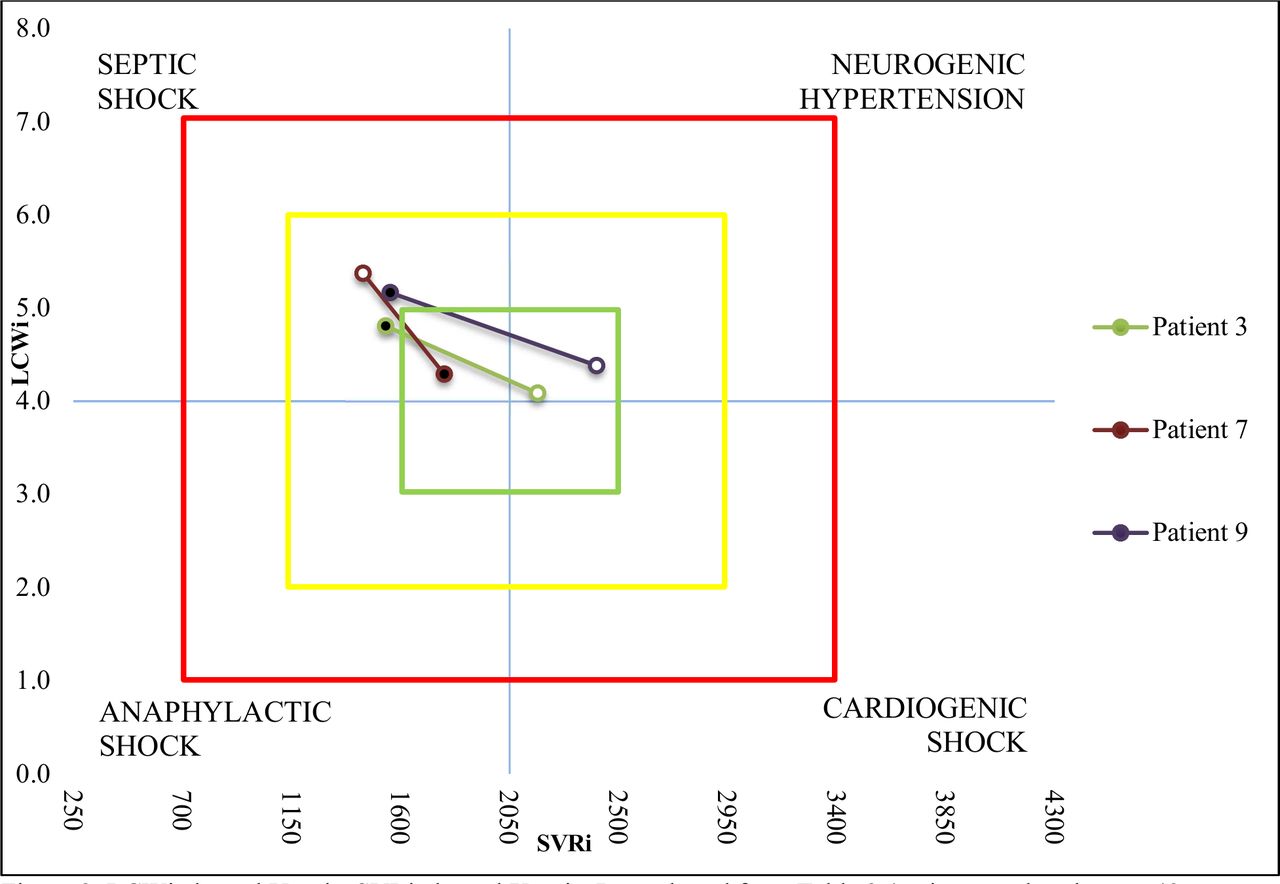
Hemodynamic cross charting of patients 3, 7, and 9. LCWi is shown in the y-axis, whereas SVRi is shown in the x-axis. Data plotted from table 2 (patient 3, a 46-year-old woman with urosepsis; patient 7, a 33-year-old man with urosepsis; patient 9, a 44-year-old man with liver abscess that grew group C streptococcus and Escherichiacoli). T0 is shown as black circle. T1 is shown as white circle. Green, yellow, and red squares represent normal, abnormal, and profoundly abnormal values, respectively. Septic shock shown in the upper left corner identified as low SVRi and high LCWi. Anaphylactic shock shown in the lower left corner identified as low SVRi and low LCWi. Cardiogenic shock shown in the lower right corner identified as high SVRi and low LCWi. Neurogenic hypertension (ie, catecholamine-induced hypertension as would be exhibited in a pheochromocytoma) shown in the upper right corner identified as high SVRi and high LCWi. LCWi, left cardiac work index; SVRi, systemic vascular resistance index. T0, time prebolus; T1, time + 1 hour postbolus.
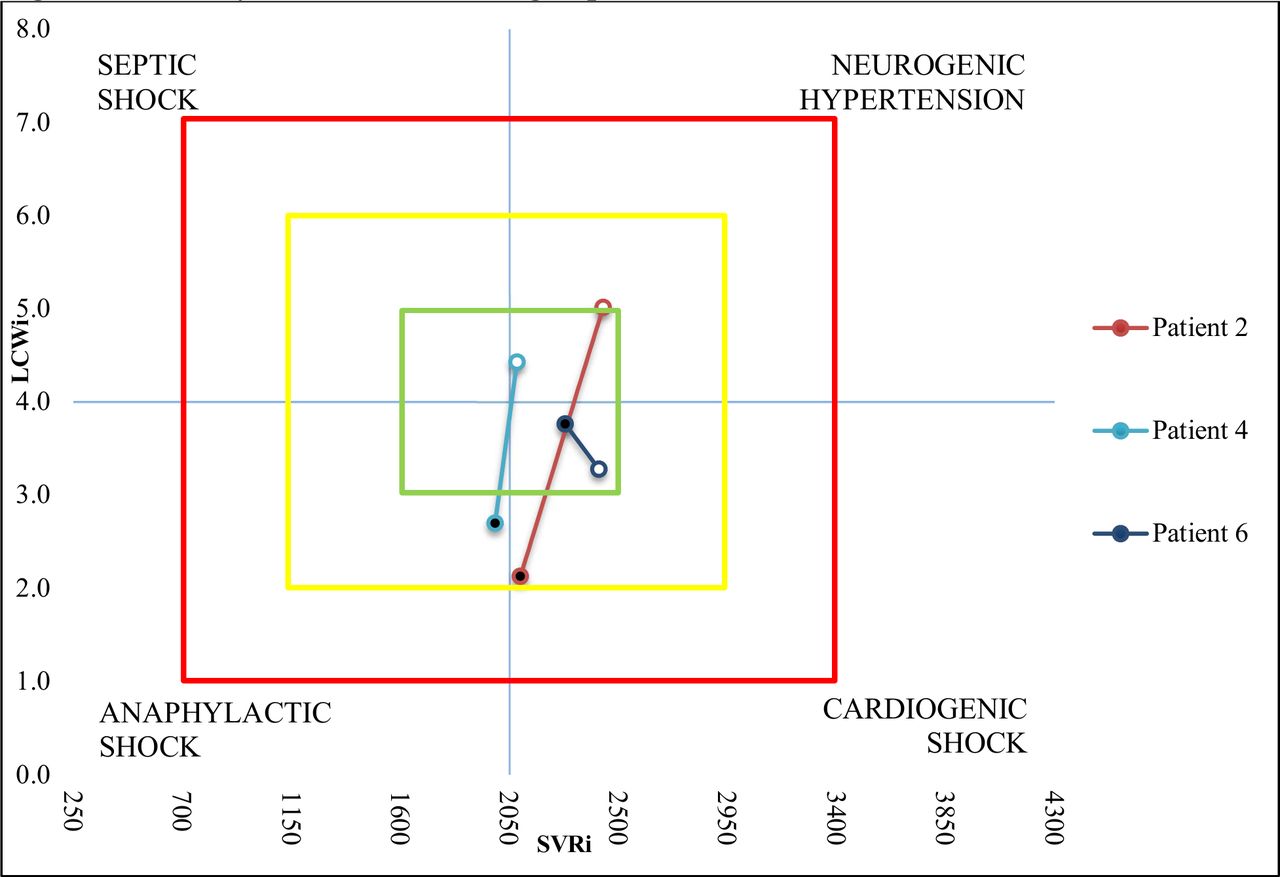
Hemodynamic cross charting of patients 2, 4, and 6. LCWi is shown in the y-axis, whereas SVRi is shown in the x-axis. Data plotted from table 2 (patient 2, a 77-year-old man with chronic obstructive pulmonary disease who developed pneumonia; patient 4, a 42-year-old man who developed sulfa-induced hepatitis; patient 6, a 79-year-old man who developed pneumonia). T0 is shown as black circle. T1 is shown as white circle. Green, yellow, and red squares represent normal, abnormal, and profoundly abnormal values, respectively. Septic shock shown in the upper left corner identified as low SVRi and high LCWi. Anaphylactic shock shown in the lower left corner identified as low SVRi and low LCWi. Cardiogenic shock shown in the lower right corner identified as high SVRi and low LCWi. Neurogenic hypertension (ie, catecholamine-induced hypertension as would be exhibited in a pheochromocytoma) shown in the upper right corner identified as high SVRi and high LCWi. LCWi, left cardiac work index; SVRi, systemic vascular resistance index. T0, time prebolus; T1, time + 1 hour postbolus.

Hemodynamic cross charting of patients 1, 5 and 8. LCWi is shown in the y-axis, whereas SVRi is shown in the x-axis. Data plotted from table 2 (patient 1, a 77-year-old man with diabetes with a foot wound growing Pseudomonas; patient 5, a 42-year-old man with a soft tissue infection; patient 8, a 68-year-old woman with diabetes with coagulase-negative staphylococci infection and positive blood cultures). T0 is shown as black circle. T1 is shown as white circle. Green, yellow, and red squares represent normal, abnormal, and profoundly abnormal values, respectively. Septic shock shown in the upper left corner identified as low SVRi and high LCWi. Anaphylactic shock shown in the lower left corner identified as low SVRi and low LCWi. Cardiogenic shock shown in the lower right corner identified as high SVRi and low LCWi. Neurogenic hypertension (ie, catecholamine-induced hypertension as would be exhibited in a pheochromocytoma) shown in the upper right corner identified as high SVRi and high LCWi. LCWi, left cardiac work index; SVRi, systemic vascular resistance index; T0, time prebolus; T1, time + 1 hour postbolus.
The use of urine output as an indicator of adequate fluid resuscitation can be obscured in patients with pre-existing chronic kidney disease, dialysis dependence, or obstructive nephropathy. In these patients, urine output as a physiologic indicator becomes unreliable. Patients on anticoagulants may show coagulopathy not necessarily attributable to the active disease process of a patient with sepsis, making those values for markers of end-organ dysfunction unreliable. Additionally, any number of physiologic processes may elevate serum lactate (ie, seizures, pulmonary edema, malignancy, hypoglycemia and so on), making them less than unreliable and non-specific toward the diagnosis of sepsis. This emphasizes the need to seek alternative adjunctive, quantifiable measurements for use in diagnosing and resuscitating patients with sepsis.
Several limitations of this study exist, including the small sample size and the lack of providers being blinded to the results. Incidentally, the screening of patients included within this study was ultimately at the discretion of the emergency medicine physician by directing those consults to the general surgery service for presuming a surgical source of their sepsis. Likely during the time period of this study, many patients were referred to the medical intensivist service for sepsis management for which we were not a party to their carecare. Additionally, the severe sepsis alert used in the protocol of this project is based on the dated SIRS criteria, which has been widely criticized for being too non-specific. Furthermore, it has now been replaced with the outcomes-directed assessments of Sequential Organ Failure Assessment and quick Sequential Organ Failure Assessment.11 Further, the exact timing of antibiotic initiation in these patients was not factored into the responses observed on impedance cardiography, as they all received antibiotics at presentation, but at different times from arrival. Lastly, this study was limited to the immediate resuscitation of patients with sepsis with crystalloid boluses—it was not performed on patients requiring vasopressors or during the ongoing management of patients beyond the time required for a 2 L bolus, although, despite these limitations, the data derived from this study show, with statistical significance, a potential use for non-invasive cardiac impedance monitoring in the initial resuscitative phase of sepsis.
Conclusion
Impedance cardiography may be useful in the early detection of sepsis. Readings with increased LCWi and, significantly, low SVRi are potential indicators for sepsis. The impedance indices of SVR and SVRi appear to be sensitive to fluid shifts. Similarly, impedance cardiography can identify different varieties of shock. Future studies may solidify the role of impedance cardiography as an adjunct to the management of patients with sepsis.
Acknowledgments
The authors would like to acknowledge and thank Dr James Yuschak and Dr Ryan Shadis for their assistance and mentorship in this project.
Footnotes
Contributors Authorship criteria were met by all listed authors. These authors have sufficiently participated in the work and are willing to take responsibility, publicly, for its content. Additionally, this work has not, nor will be, submitted to any other journal for publication before Trauma Surgery & Acute Care Open. Conception or design of the work: YS, AS, and TV. Data collection: YS and AS. Data analysis and interpretation: JB and YS. Drafting the article: JB and YS. Critical revision of the article: JB, YS, AS, OCK, and TV. Final approval of the version to be published: JB, YS, AS, OCK, TV.
Funding The authors have not declared a specific grant for this research from any funding agency in the public, commercial or not-for-profit sectors.
Disclaimer The cardiographic bioelectrical impedance measurements obtained in this study were performed with PhysioFlow. No financial relationship exists between the investigation team and the product developer of PhysioFlow, a product of Manatec Biomedical.
Competing interests None declared.
Patient consent for publication Not required.
Ethics approval The study was approved by the institutional review board.
Provenance and peer review Not commissioned; externally peer reviewed.
Data availability statement All data relevant to the study are included in the article.