Article Text

Abstract
Background Trauma is a leading global cause of death. Trauma mortality rates are higher in rural areas, constituting a challenge for quality and equality in trauma care. The aim of the study was to explore population density and transport time to hospital care as possible predictors of geographical differences in mortality rates, and to what extent choice of statistical method might affect the analytical results and accompanying clinical conclusions.
Methods Using data from the Norwegian Cause of Death registry, deaths from external causes 1998–2007 were analysed. Norway consists of 434 municipalities, and municipality population density and travel time to hospital care were entered as predictors of municipality mortality rates in univariate and multiple regression models of increasing model complexity. We fitted linear regression models with continuous and categorised predictors, as well as piecewise linear and generalised additive models (GAMs). Models were compared using Akaike's information criterion (AIC).
Results Population density was an independent predictor of trauma mortality rates, while the contribution of transport time to hospital care was highly dependent on choice of statistical model. A multiple GAM or piecewise linear model was superior, and similar, in terms of AIC. However, while transport time was statistically significant in multiple models with piecewise linear or categorised predictors, it was not in GAM or standard linear regression.
Conclusions Population density is an independent predictor of trauma mortality rates. The added explanatory value of transport time to hospital care is marginal and model-dependent, highlighting the importance of exploring several statistical models when studying complex associations in observational data.
This is an Open Access article distributed in accordance with the Creative Commons Attribution Non Commercial (CC BY-NC 4.0) license, which permits others to distribute, remix, adapt, build upon this work non-commercially, and license their derivative works on different terms, provided the original work is properly cited and the use is non-commercial. See: http://creativecommons.org/licenses/by-nc/4.0/
Statistics from Altmetric.com
Introduction
Trauma is a leading global cause of death.1 Trauma mortality rates are higher in rural areas,2–5 and the majority of injury deaths in rural areas occur before the victims reach hospital.6–9 Rural populations are less likely to reach centralised trauma services,6 ,10 and the benefit of centralisation of trauma management for rural areas can be debated.8 ,11–13 Regions with large rural areas thus constitute a challenge for equality in trauma care.14 ,15
In order to identify high-risk areas, various measures of rurality as potential predictors of differences in mortality rates should be explored. Recent national studies point to large urban–rural differences for both paediatric and adult trauma mortality, using municipal centrality, municipal settlement density and population density as measures of rurality.16 ,17 For adults, municipal population density was found to be the strongest predictor of rural trauma mortality rates.16 Transport time to hospital care may increase with rurality, and this has been associated with increased trauma mortality rates.5 ,7 ,18 ,19 However, the relative contribution of transport time in the overall increased mortality rates found in rural areas remains to be determined. Geographical mapping and population-based exploration of transport time as a risk factor of trauma mortality may add valuable information when organising trauma care.
In previous studies on the association between population density and mortality rates, population density has been categorised in regression models.16 ,17 ,20 While categorisation is often argued as being both clinically meaningful and a reasonable remedy for handling non-linearity, the effect of categorising continuous variables has been argued against in the statistical literature.21–23 Categorisation of continuous predictors in regression models, however, continues to be common in medical research. To explore to what extent the choice of statistical model might affect results and accompanying clinical conclusions, we assessed the association between municipality trauma mortality rates and the predictors population density and travel time to hospital care in minutes by fitting various univariate and multiple linear and non-linear regression models.
Population density has previously been found to be a significant measure of rural injury mortality rates in the data material used in this study. The aim of the present work was to explore whether travel time to hospital held additional value as a risk factor for injury mortality and to what extent this variable could account for the increased risk seen in rural areas. Various statistical methods were applied to fully explore the relationship between the outcome and the predictors of interest. The potential for conflicting clinical interpretations as a consequence of choice of statistical method is addressed in detail.
Materials and methods
Study setting
Mainland Norway is 323 780 km2, stretching 1790 km from north to south. Rural trauma care is characterised by long prehospital distances and numerous smaller hospitals.15 The main prehospital emergency medical system (EMS) service is the paramedic manned ground ambulances. The ambulance personnel has either a basic or a bachelor-level paramedic training,24 the latter capable of establishing basic intravenous access and administering fluids and medications to trauma patients by offline medical direction. Paramedic manned services perform basic airway management, while more advanced procedures are only performed by prehospital physicians. Norway has a nationwide anaesthesiologist manned air ambulance service with 11 helicopter ambulance bases and six search and rescue helicopter bases. All emergency medical calls are handled by emergency medicine communications centres staffed with registered nurses.24
Data material
Municipality mortality rate
The study is based on data from the Cause of Death (CoD) registry, Statistics Norway.25 Trauma deaths in the CoD registry uses the International Classification of Diseases, 10th Revision chapter 20—“External causes of morbidity and mortality”. Details on registry codes have been published previously.16 The registry does not hold physiological and anatomical data necessary for the calculation of, for example, ISS or revised trauma scores.
The database holds consecutively collected data on all deaths nationally. Deaths from external causes in the 10-year period 1998–2007 were analysed, excluding deaths from medical and iatrogenic causes.16 The study focus was the adult working population, and as the standard age of retirement in Norway is 67 years, deaths in persons from 16 to 66 years of age were included. The year 2002 was used as an index year. In 2002, the Norwegian population was 4.5 million, of which 3 million were from 16 to 66 years of age, and Norway was divided into 434 municipalities.26 During the 10-year period, there were a total of 8466 deaths from injuries in the age group, from which the municipal mortality rates per 100 000 were calculated.
Population density
Municipality population density was defined as the number of inhabitants per square kilometre (inh/km2) based on the 2002 population from the Norwegian Social Science Data Services database.27 Norway has a mixed rural and urban population with county population density from 1129.5 inh/km2 in Oslo to 1.5 inh/km2 in Finnmark. Following a previous publication on the same data,16 the variable was categorised according to quartiles of population density when weighted by the total population, so that each category represents the same amount of people. First quartile (most rural): <18.2 inh/km2; second quartile (rural): 18.2–76.9 inh/km2; third quartile (central): 77.0–442.7 inh/km2; and fourth quartile (most central): ≥442.7 inh/km2, with the latter category as the reference.
Travel time to hospital care
Variables on access to hospital emergency department (ED) were calculated from Statistics Norway's demographical and geographical data using ArcGIS software (Environmental Systems Research Institute, Redlands, California, USA). The smallest unit of geographical data in the data set is the basic statistical unit (BSU).28 In 2002, there were 13 425 inhabited BSUs in Norway, and 99.8% of the population was assigned geographically to a BSU. The 434 municipalities had a median (IQR) of 19 (12–33) BSUs. Each BSU has a population centre representing the averaged geographical location of the BSU's residencies. The transport time from each BSU's population centre to nearest hospital ED was based on road network data, including speed limits, from the Norwegian Mapping Authority and The Norwegian Roads Administrations29 in the index year 2002. For BSUs where sea transport was necessary, transport times were calculated by 15 km/h travel speed for the port-to-port distance. In 393 (2.9%) of the BSUs, there was insufficient data to calculate the transport distance and time. This affected 107 of 434 of the municipalities, but only 16 municipalities had data missing on >20% of their BSUs. In these municipalities, the data from the remaining BSUs were applied, after appropriateness was assessed by visual inspection of mapping in ArcGIS. The transport time from each municipality's BSU to the nearest hospital ED was calculated, weighted by the number of inhabitants in the BSU. County and national averages were calculated similarly. Following a previous publication on the same material,16 municipality travel time to hospital care was categorised according to [0,30), [30,60), [60,120) and [120,→) minutes, with the first category as the reference.
Statistical methods
Population density and travel time to hospital care were included as explanatory variables in various univariate and multiple regression models, both as continuous variables and categorised according to the above criteria, with municipality mortality rate as the dependent variable. We fitted linear and piecewise linear regression models,30 as well as generalised additive models (GAMs).31 While a linear regression model assumes a linear relationship between the independent and dependent variable across the whole observed range of the independent variable, GAM imposes minimal restrictions on the underlying relationship between the independent and the dependent variable by fitting a suitable non-linear spline function, that is, a set of polynomials. The optimal spline was chosen using cross-validation.32 Piecewise linear models are intermediate between these, assuming a series of linear segments and accompanying breakpoints estimated from the data.
The regression models were compared using Akaike's information criterion (AIC).33 AIC is a weighting between parsimony and model fit to the data and is an objective measure of the ‘goodness’ of a model; the lower the AIC the better. Note that it is not the absolute value of AIC that is important but the relative values between models and, in particular, the AIC differences Δi=AICi−AICmin.34 The model estimated to be the best has Δi≡Δmin≡0. Models with Δi>10 relative to the best model have essentially no support in the data, while models with 0≤Δi≤2 have substantial support.34
Træna is a municipality off the coast of northern Norway, consisting of >1000 small islands. There are no roads or bridges connecting the 500 inhabitants to the main land, and the nearest hospital is hours away by boat and car. Træna is an extreme outlier with respect to mortality rates (figure 1A, B), distorting the results for the rest of the municipalities in some of the regression models (not shown). Træna was thus removed from the data set in the statistical analyses.
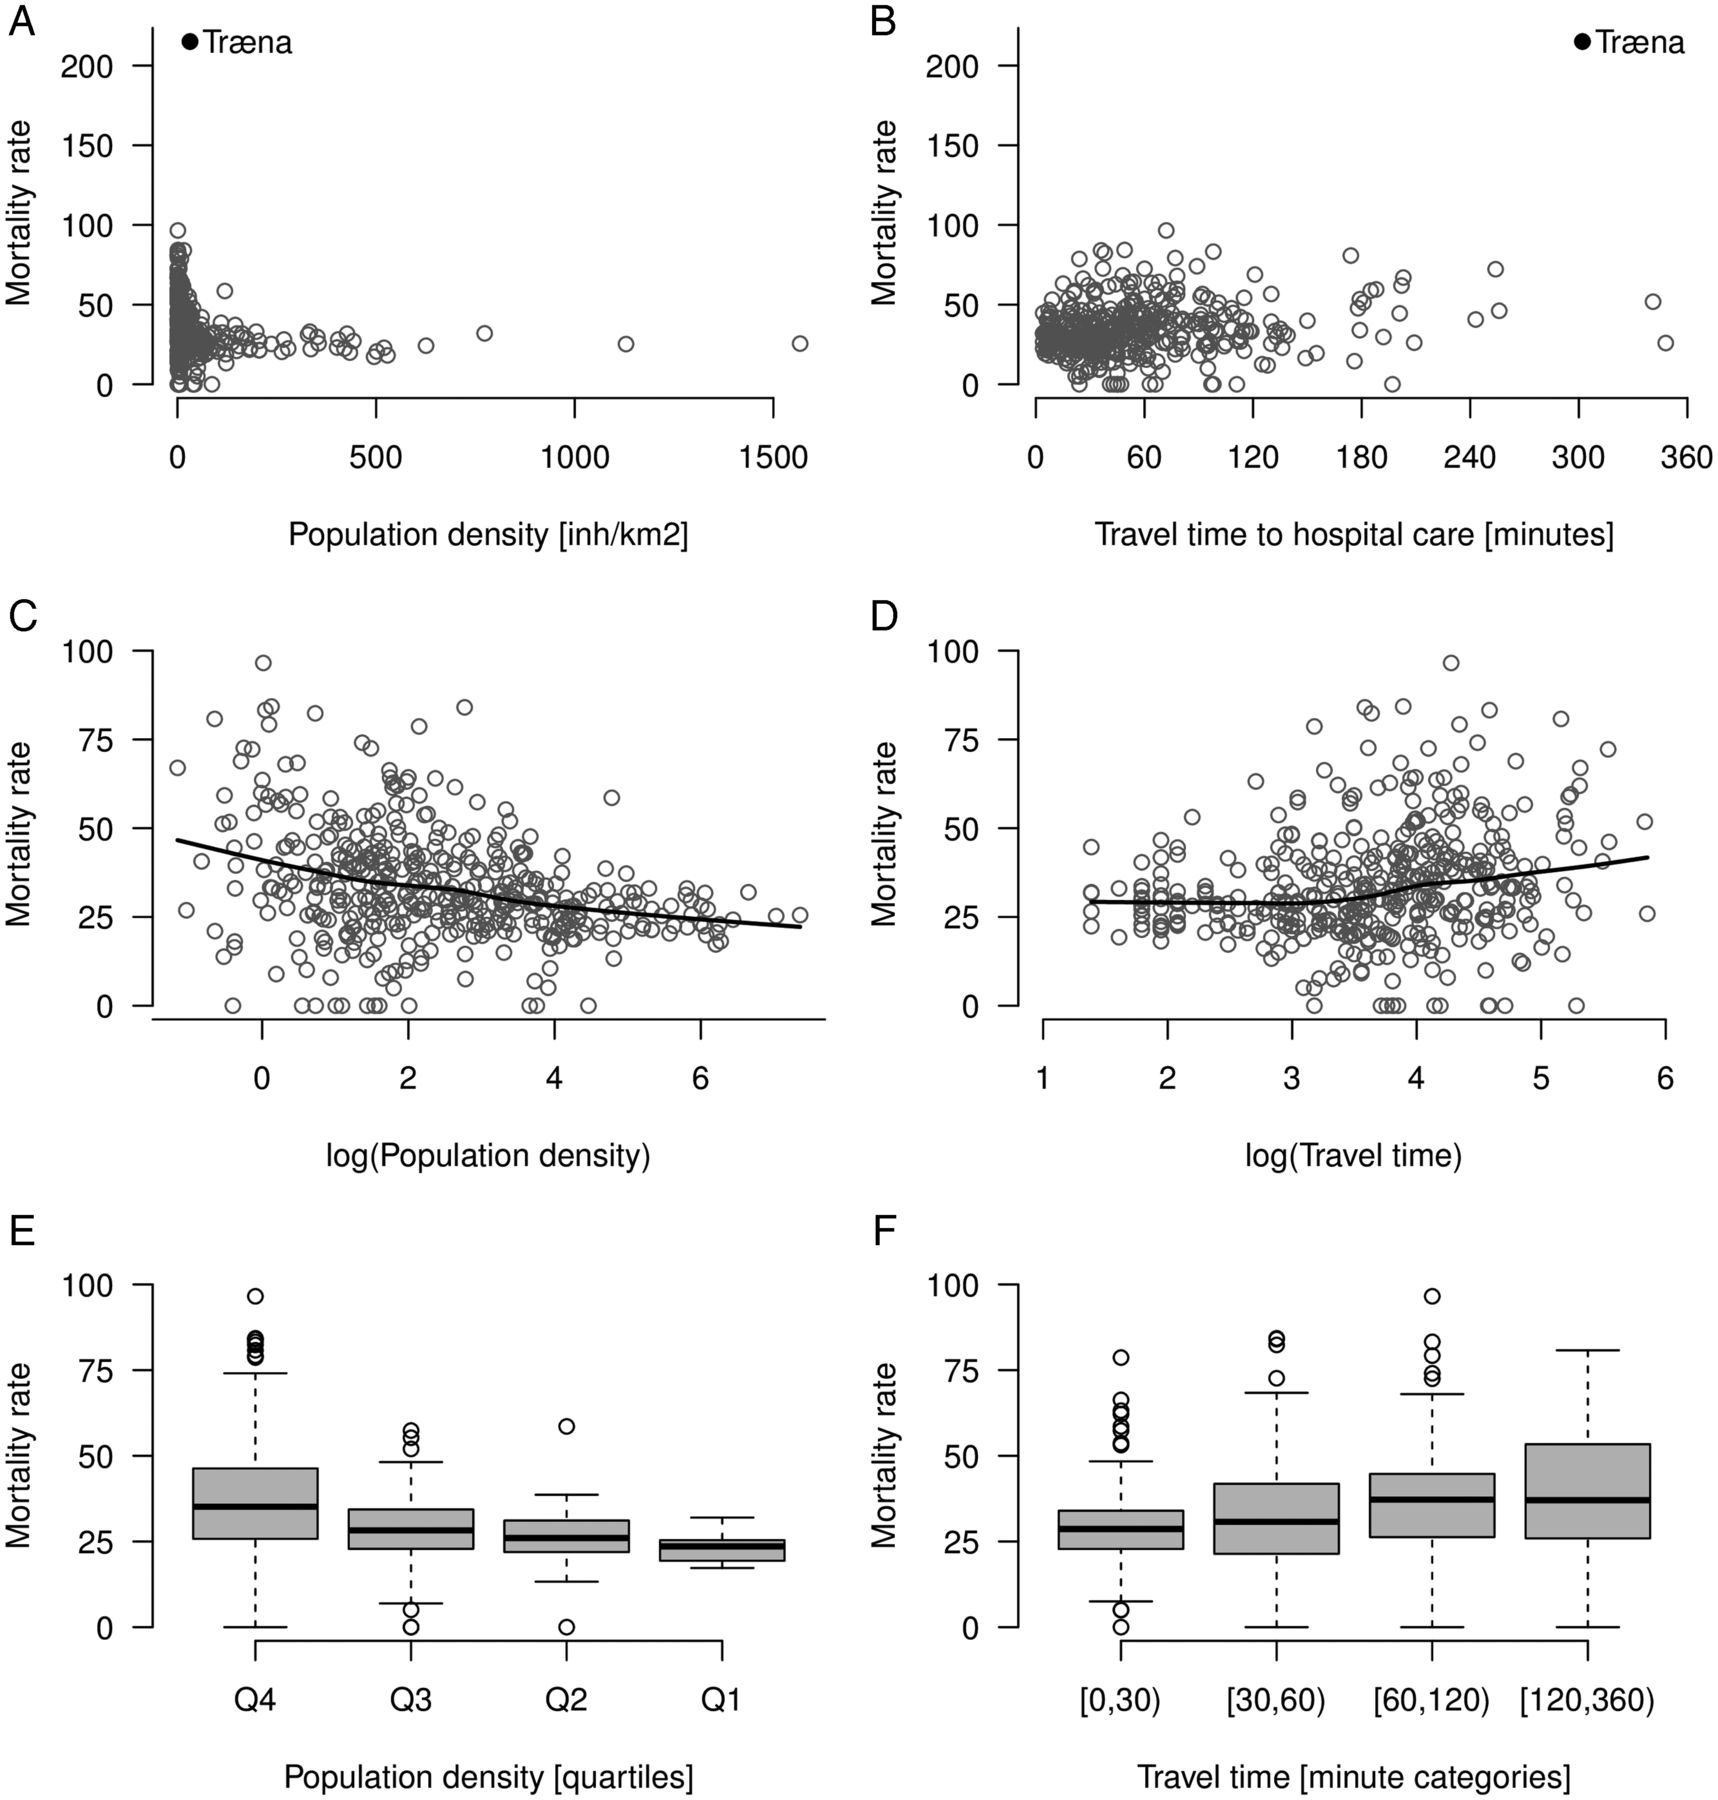
Bivariate associations between mortality rates in 434 Norwegian municipalities and population density and transportation to hospital care. Scatterplot of raw data (A and B); log data with lowess line superimposed (C and D); categorized predictors according to quartiles and predefined categories (E and F). In figures C–F the outlier Træna has been removed. In the accompanying statistical analyses data were weighted with respect to municipality population.
The explanatory variables were heavily skewed and log-transformed prior to statistical analyses. All statistical analyses were performed in R 3.0.1.35
Results
The bivariate association between the two continuous explanatory variables and the dependent variable is shown in figure 1. For population density, figure 1C indicates an increasing risk of mortality with decreasing population density across the whole observed range of values. For travel time to hospital care, figure 1D indicates no added risk of increasing time from hospital up until approximately exp(3.5)≈30 min, after which the risk increases linearly with increasing travel time. Categorising the predictors, these details are obscured (figure 1E, F). Results from the various fitted statistical models are presented below.
Linear models with continuous predictors
In univariate linear regression models, the two continuous explanatory variables are highly statistically significant, with population density being the stronger predictor in terms of AIC (table 1). When entering both in a multiple regression model, only population density remains statistically significant. However, as visual inspection indicates non-linearity in the data, results from this model should be interpreted with care.
Linear regression models with mortality rate in 434 Norwegian municipalities as dependent variable and population density and travel time to hospital care in minutes as predictors
Linear models with categorised predictors
In univariate regression models with categorised predictors, all categories are statistically significant relative to the reference category for both explanatory variables (table 2). When entering both in a multiple regression model, population density remains statistically significant, as do the two upper categories for travel time to hospital care, representing travel time >60 min. The models are generally somewhat weaker in terms of AIC than when using continuous linear predictors.
Linear regression models with mortality rate in 434 Norwegian municipalities as dependent variable and population density and travel time to hospital care in minutes as categorical predictors
Generalised additive models
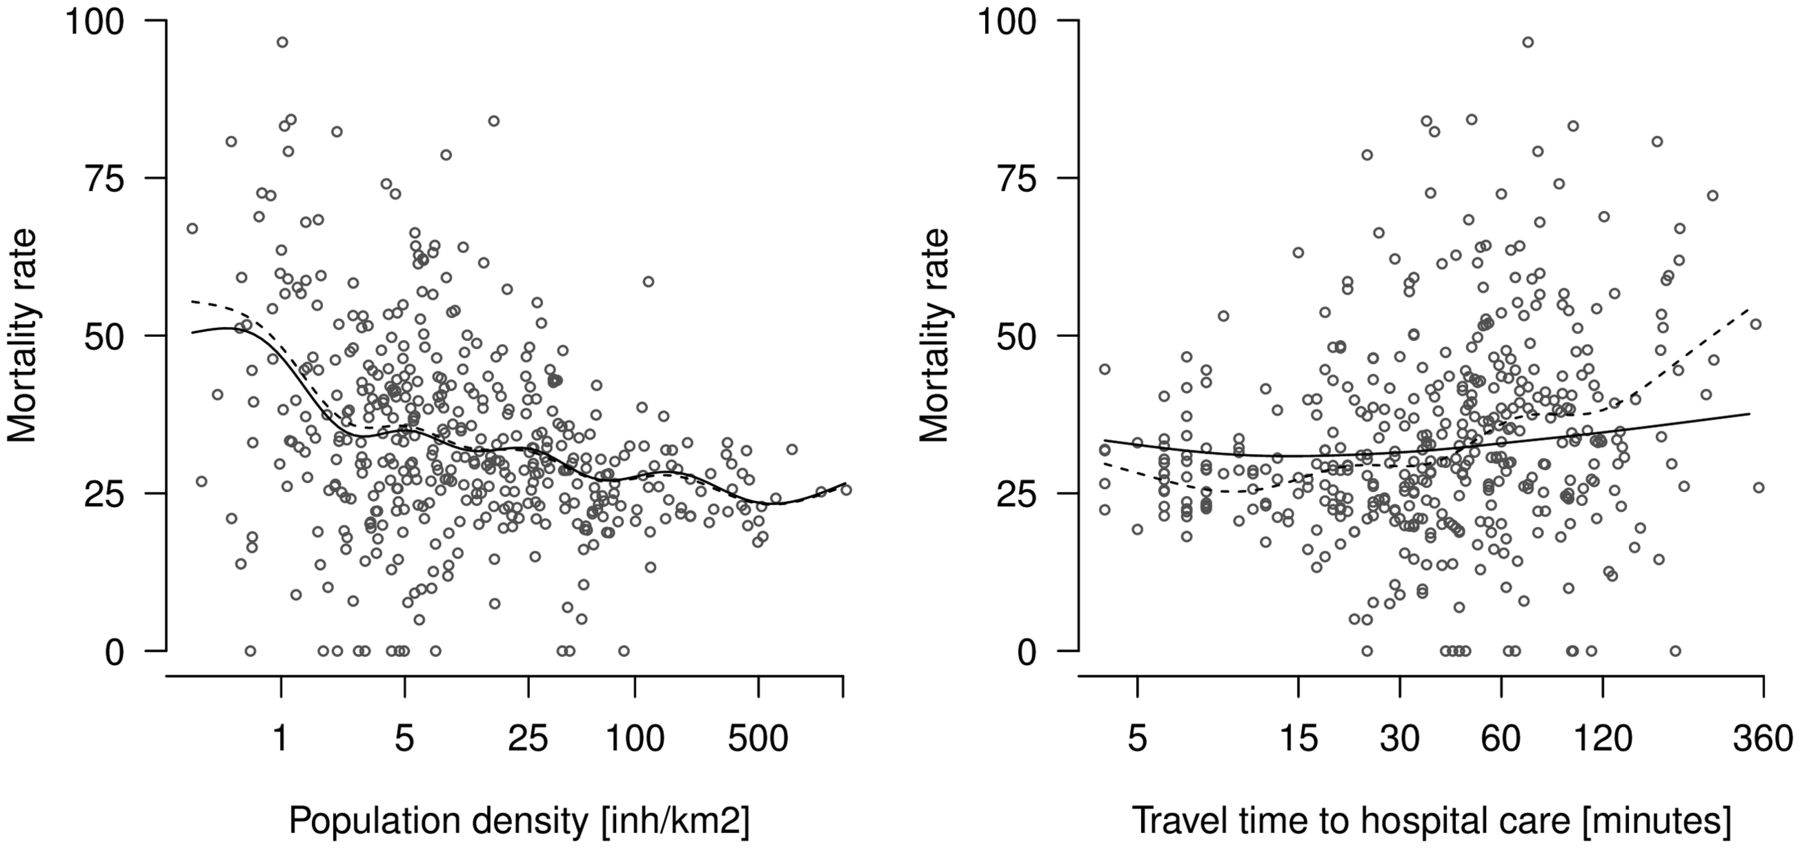
In order to explore the potential non-linearity observed in figure 1C, D, we fit univariate and multiple GAMs (figure 2). In univariate GAMs, both explanatory variables are statistically significant, with population density the stronger predictor (table 3). When entering both in a multiple GAM, only population density remains statistically significant. In terms of AIC, the multiple GAM significantly outperforms all of the above models.
Generalised additive regression models with mortality rate in 434 Norwegian municipalities as dependent variable and population density and travel time to hospital care in minutes as predictors

Generalized Additive Models (GAM) with pre-hospital mortality rates in 434 Norwegian municipalities as outcome and population density and travel time to hospital care as predictors; univariate models (dotted line) and multiple model (solid line). See Table 3 for AIC, and p-values.
Piecewise linear models
Visual inspection of the GAM analyses indicates a piecewise linear relationship between the two predictors and mortality rate (figure 2). Univariate piecewise linear models estimate a breakpoint for population density at approximately exp(0.79) ≈2.2 inh/km2, with a considerably larger slope before the breakpoint than after, and at approximately exp(2.37)≈10.7 min for travel time to hospital care, with a negative slope before the breakpoint and a positive slope after. All of the linear relationships are statistically significant (table 4). In a multiple piecewise linear model, the associations are attenuated, but both upper linear segments remain statistically significant. In terms of AIC, the multiple piecewise linear model is the strongest model of all, though only marginally better than the multiple GAM.
Piecewise linear regression models with mortality rate in 434 Norwegian municipalities as dependent variable and population density and travel time to hospital care in minutes as predictors
Discussion
Exploring several statistical models, we found population density to be a strong and independent predictor of municipality mortality rates, strengthening previously published findings.16 In trauma care, time from injury to definitive treatment is important, and it is reasonable to assume that municipality travel time to hospital care is an independent predictor of municipality mortality rates. However, our analysis indicates that this is debatable as its explanatory value strongly depends on the choice of statistical method.
A traditional multiple linear regression model suggests that travel time does not identify any added risk. However, in a multiple regression model applying predefined and clinically meaningful categories, travel time over 60 min is a risk factor, with a fivefold and sevenfold increase in mortality rates for transport times being 60–120 and >120 min, respectively. However, this model has relatively poor fit to the data compared with the mathematically optimal non-linear models; a GAM and a piecewise linear model. Surprisingly, in a multiple GAM, there is no evidence of a significant effect of travel time to hospital care, while the marginally stronger piecewise linear multiple model suggests that above 10 min travel time increased travel time is associated with increased mortality rates.
Both by visual inspection of the data and in terms of objective model selection criteria there is strong evidence of a non-linear relationship with municipality mortality rates for both predictors. Historically, categorisation has often been applied as a remedy for handling non-linearity. Recent research, however, shows that such categorisation is generally not advisable.21–23 Categorisation leads to loss of power,36 ,37 which might explain the poorer fit to the data in terms of AIC for this model. However, with 4–5 categories, rather than mere dichotomisation, loss of information can be quite small.21 A recent study suggests using GAM to establish cut-offs to be used when categorising continuous predictors.38 Notably, in the present study, dichotomisation based on the estimated breakpoints in the piecewise linear model leads to a far poorer model fit than when using predefined and clinically meaningful categories (not shown).
Recent modern statistical regression models such as GAMs31 ,32 and piecewise linear models30 are specifically developed for handling non-linear relationships in the data. While GAM is a great exploratory tool for establishing whether non-linearities should indeed be taken into account, results from GAMs can be difficult to translate into clinical practice. Piecewise linear models are more tractable in this sense, separating the data into regions with easier-to-interpret linear relationships between predictors and outcome, along with an estimate of where these linear relationships change significantly.
A data-driven breakpoint model for population density, rather than predefined categories, has strong clinical implications as to what is to be defined as a high-risk municipality. The most rural category, that is, the upper population quartile, which had the highest mortality rate, ranges from 0 to 18.2 inh/km2, and entails 277 of the 433 (64%) municipalities. These municipalities inhabit 1 130 000 out of 4 520 000 (25%) inhabitants. By this definition of high-risk municipalities, previous studies have found 33% and 50% excess mortality rate in the working-age and paediatric populations, respectively.16 ,17 The piecewise linear model, on the other hand, estimates the location of a significant breakpoint at only 2.2 inh/km2, which entails 69 of the 433 (16%) of the municipalities. These are sparsely populated municipalities, and the breakpoint at 2.2 inh/km2 entails municipalities with a population of only 140 000 out of 4 520 000 (3.0%) inhabitants, and only 360 of 8500 (4.2%) of trauma deaths in the study population. The attributable risk of population density below this extreme value is greater by far (table 4). However, it is only relevant for a small fraction of the population and from a clinical perspective this breakpoint is therefore of limited value. Even more, while the breakpoint model gives a more precise estimate of the linear effect of population density above this breakpoint compared with the linear model with a continuous predictor, the adjustment is miniscule, from −2.28 to −2.02 (table 4), and clinically irrelevant.
For travel time to hospital care, there is a significant breakpoint in the relationship between travel time to hospital care and municipality mortality rates as low as exp(2.37)≈10.7 min. This breakpoint is of limited clinical value as people who live closer than 30 min to a hospital live close to a hospital by all practical measures. More interesting is the adjustment in the estimated relationship between travel time to hospital care and mortality rates by introducing this breakpoint. In the standard multiple linear regression model, there is no association between travel time to hospital care and mortality rates, but the more refined piecewise linear model reveals that above the very low threshold of 10 min longer distance is increasingly associated with higher mortality rates.
Our results contribute to the growing evidence that access–outcome relationships in health research are highly complex. Increased mortality associated with rural residency is in agreement with earlier studies.5 ,39 ,40 Possible explanations are less access to medical care and high risk of fatalities from farm equipment and other risks associated with working in the outdoors.39 Unintentional injury rates have also been found to be higher in rural areas.41 Notably, the association between population density and prehospital mortality rates has also been found to be age dependent.42 A study examining motor vehicle mortality by county found an inverse relation with population density areas,2 and this has since been confirmed in several studies.5 ,39 ,40 ,43 This is likely related to the increased distances travelled in rural areas,2 but it has also been suggested that persons in high-risk rural areas may have less access to newer, more crashworthy cars and safer roads and more exposure to hazardous driving conditions and behaviour.39 Interestingly, the increased prehospital mortality in MVC in rural areas appears to be caused by factors influencing the type and severity of injuries rather than access to or performance of EMS.42
The present study is based on central registry data, and not registries designated for trauma research, introducing important limitations.16 First, the registry does neither hold anatomical or physiolocal data needed to calculate, for example, ISS or probability of survival, nor data on the level of prehospital or intrahospital care. Such factors could thus not be adjusted for in the statistical models. Second, Norway has a national air ambulance service, but as the CoD does not document the mode of patient transportation, estimated transport times to hospital care are calculated mainly based on transport times to nearest hospital by road transport. Note, however, the inclusion of marine data for access calculations, which is uncommon in the literature and strengthens the study. Finally, the study period 1998–2007 was prior to any formal trauma system implementation in Norway, and no formal trauma centres were yet established. Still, it is reasonable to assume that differences between large and small hospitals in available resources for trauma management existed, but such differences are not reflected in the data set. All hospitals have been dealt with equally in the analyses.
Rurality has been linked to increased mortality in several studies, and robust measures of rurality is thus of great interest. This study confirms population density as an independent predictor of municipality mortality rates. Population density is a pragmatic and easily accessible risk factor, compared with, for example, travel distances to healthcare facilities, and can aid policymakers and professionals involved in primary preventive work. The study, however, remains inconclusive as to whether travel time to hospital care holds additional information as the statistical significance of the variable depends on choice of statistical method. The study demonstrates how different statistical methods can result in different, even opposite, clinical interpretations within the same data set. When exploring complex associations between explanatory and dependent variables in observational studies, care must be taken to apply statistical models that fit the properties of the data, and optimally several statistical models should be applied to exclude model-dependent associations.
What is already known on the subject
Rural areas have a higher risk for injury mortality. However, what constitutes informative and reliable measures of rurality in trauma research, and thus good predictors of the increased mortality risk, remains to be identified.
The estimated association between a predictor and the outcome depends on the choice of statistical method. Traditional linear regression models may be too crude when assessing associations in complex data.
What this study adds
Population density is confirmed as an independent and informative predictor of rural trauma mortality.
The estimated effect of transport time to hospital care is highly dependent on choice of statistical model, being both statistically significant and non-significant in both traditional and modern statistical methods.
In the same way as different predictors are explored when investigating associations in complex data sets, so should different statistical methods, in order to rule out model-dependent associations.
Ziplining hazard
A report in the Am J Emerg Medicine notes that ziplines have increased in popularity in the USA in the last 15 years, and the number of injuries has also increased. Since 1997, there were 16 000 visits to US emergency departments, mostly for falls resulting in fractures. There are many safety guidelines, but Gary Smith argues that there should be uniform safety standards in all jurisdictions.
Less fear reduces risk of elderly fall injuries
Reducing the fear of falling may reduce the risk of fall injuries in the elderly. An unpublished report suggests that those who worry about falling tend to reduce their activity levels and become more sedentary. This leads to weaker lower body strength and balance. A programme intended to address this found that 24% of participants reported feeling less fearful about falling, and 20% said they were less likely to limit their activities. Reported fall rates declined by 29% in the first year of the programme.
Johnson & Johnson donates helmets to Vietnamese children
The Asia Injury Prevention Foundation's Helmets for Kids programme supported by Johnson & Johnson (JJ) gave 6115 helmets to 44 primary schools in Vietnam. A spokesperson stated, “… the helmet use rate among students in JJ project schools increased to over 95%”.
Acknowledgments
The authors would like to thank Even Høydahl at Statistics Norway for invaluable help in extracting data and generating explanatory variables.
References
Footnotes
Twitter Follow Jo Røislien at @joroislien
Contributors JR performed the statistical analyses and drafted the manuscript. TK defined the original study hypothesis, acquired the data, computed and constructed the data variables and the database. All authors contributed to the discussions about the topic, revision of the manuscript and to the final approval of the manuscript.
Competing interests None declared.
Provenance and peer review Not commissioned; externally peer reviewed.