Article Text

Abstract
Objective: To determine if any of five different state gun laws were associated with firearm mortality: (1) “shall issue” laws permitting an individual to carry a concealed weapon unless restricted by another statute; (2) a minimum age of 21 years for handgun purchase; (3) a minimum age of 21 years for private handgun possession; (4) one gun a month laws which restrict handgun purchase frequency; and (5) junk gun laws which ban the sale of certain cheaply constructed handguns.
Design: A cross sectional time series study of firearm mortality from 1979 to 1998.
Setting: All 50 states and the District of Columbia.
Subjects: All residents of the United States.
Main outcome measures: Firearm homicides, all homicides, firearm suicides, and all suicides.
Results: When a “shall issue” law was present, the rate of firearm homicides was greater, RR 1.11 (95% confidence interval 0.99 to 1.24), than when the law was not present, as was the rate of all homicides, RR 1.08 (95% CI 0.98 to 1.17), although this was not statistically significant. No law was associated with a statistically significant decrease in the rates of firearm homicides or total homicides. No law was associated with a statistically significant change in firearm suicide rates.
Conclusion: A “shall issue” law that eliminates most restrictions on carrying a concealed weapon may be associated with increased firearm homicide rates. No law was associated with a statistically significant reduction in firearm homicide or suicide rates.
- ICD-9, International Classification of Diseases, Ninth Revision
- firearms
- homicide
- legislation
- suicide
Statistics from Altmetric.com
During 2001 there were approximately 81 firearm fatalities each day in the United States1,2 Over the decade 1991–2000, 215 822 homicides occurred, of which 147 281 (68%) were committed with a firearm, and 305 384 suicides occurred, of which 179 244 (59%) were committed with a firearm.3
Legislators have passed many state level statutes regulating ownership or access to handguns with the anticipated goal of curtailing deaths related to firearms.1,4 Many laws have not been studied, and little is known about the association of these state laws with firearm deaths. For other laws, uncertainty persists regarding the presence and direction of the association with firearm mortality.5,6 Studies of “shall issue” laws that permit an individual to carry a concealed weapon unless restricted by another statute have reported decreased, unchanged, and increased homicide rates with law implementation.5,6 An evaluation of Maryland’s junk gun law, banning cheaply constructed handguns, reported both increased and decreased firearm homicide rates after law enactment, although the association and its magnitude depended upon the manner by which the effect of the law was modeled.7 Recently a study of minimum age restrictions for the purchase and possession of firearms reported that neither law appeared to reduce overall rates of suicide among youth.8 Because of the lack of evidence and continued controversy, we studied the association between five different state gun laws and four outcomes: firearm homicides, all homicides, firearm suicides, and all suicides. The laws studied were: (1) “shall issue” laws permitting an individual to carry a concealed handgun unless that person is restricted to do so by another statute; (2) laws restricting the minimum age for purchase of a handgun to 21 years; (3) laws restricting the minimum age for private possession of a handgun to 21 years; (4) one gun a month laws which restrict handgun purchase frequency to one in a 30 day period; and (5) junk gun laws which ban the sale of certain cheaply constructed handguns. We used a longitudinal analysis to estimate the adjusted rate of each mortality outcome after each law went into effect, compared with what would have been anticipated without that law. We used cross sectional time series data for all 50 states and the District of Columbia in the US with data regarding mortality, laws, and other variables for each year from 1979–98.
MATERIALS AND METHODS
Outcome data
Our main outcome measures were firearm related and total homicide, and firearm related and total suicide death rates per 100 000 person years. Total mortality rates were included in the analysis to evaluate whether any association between the law and firearm mortality rates persisted in the respective total death rate. State and year specific deaths and population data were available from the National Center for Health Statistics’ compressed mortality files for the period 1979–98.3 Data were categorized by sex, race (white, black, or other), and age (less than 1 years, 1–4, 5–9, 10–14, 15–19, 20–24, 25–34, 35–44, 45–54, 55–64, 65–74, 75–84, and older than 85 years). Violent deaths were categorized using the International Classification of Disease, Ninth Revision (ICD-9) external cause of death codes as follows: homicides (E960–969), suicides (E950–959), homicides by firearm (E965.0–965.4), and suicides by firearm (E955.0–955.4).9
Legislation data
Information about the presence of each law was obtained by reviewing the criminal statutes and codes of each state for the period 1979 through 1998. Enactment dates for each law were ascertained by reviewing the sessions of each statute for each state. From 1979–98, 23 states adopted “shall issue” laws permitting an individual to carry a concealed weapon unless restricted by another statute, seven states adopted and two states repealed a law restricting the minimum age for the private purchase of a handgun to 21 years, five states adopted laws restricting the minimum age for the private possession of a handgun to 21 years, two states adopted laws restricting the number of guns purchased to one in a thirty day period, and one state adopted a law banning the manufacture and sale of junk guns (table 1).
This information was compared with the state legislation data published by the Bureau of Justice Statistics and the Open Society Institute to confirm the laws of each state.1,4 Within each state, the time period affected by each law was considered to start with the first calendar year in which each law was in effect for at least six months. This assumes that the law’s effect occurs during the first complete year after it is implemented and that this effect is constant over time.
Statistical methods
Mortality rate ratios (RRs) were estimated using Poisson regression to compare time periods during which a law was in effect with time periods without a law within each state; hence, 50 indicator variables were included to represent each state and the District of Columbia.10 To control for national trends over time in firearm mortality rates, all states and the District of Columbia were included in the analysis, and 19 indicator variables were used to represent each calendar year. This approach attempted to control for the influences of unmodeled factors that were common across states and were associated with trends in homicide or suicide. We also controlled for state level and individual level changes in the following factors that may have influenced rates of crime and violence: proportion of the population living in metropolitan areas, proportion of the population living below the official poverty line, proportion unemployed, and age, sex, and race distribution.11–13 Each of the state level variables was measured annually except proportion living in metropolitan areas, which were statistics from the decennial census and were interpolated for intercensal years. In addition, all laws were modeled simultaneously in the regression analysis for each outcome. We used a robust (sandwich) estimator of variance, which accounts for overdispersion and for clustering of events within a state.14,15
Because temporal trends in mortality rates varied by state, we included interaction terms between each state and time (year as a continuous variable) to account for this variation, thereby modeling temporal trends in mortality rates specific to each state. In addition, because the effect of a law may vary by state, interaction terms between the categorical variables state and law were included, and state specific RRs were calculated. Each law was modeled with state interactions, while the remaining laws were included as binary covariates. Variation in state specific RRs was evaluated with both tests of homogeneity and I2.16–19 This latter statistic ranges from 0–100% and estimates the percentage of total variation in RR estimates that is due to heterogeneity between states. Because of the heterogeneity in RRs, we summarized rate ratio estimates across states using the random effects method of DerSimonian and Laird.17 The random effects summary allows for the possibility that each law may have a different effect in each state and this additional variation between states is accounted for in the confidence interval. All rate ratios were adjusted for temporal trends and for all potential confounding variables.
The minimum age laws restricted the purchase or possession of a handgun to people over 20 years of age. To evaluate whether the association of these laws with each outcome may vary with a particular age group, we introduced interaction terms between age and each of these two laws. Initially we introduced interaction terms between age (younger than 20 years, 20 years or older) and all other model terms. We chose this definition for this new dichotomous age covariate as it was compatible with the categories of age stratification provided by the available database. The model with the lowest Akaike information criteria statistic included terms for the interaction of both state and year with age.15 We then introduced a term for the interaction of age and the two laws and estimated separate RRs for each age group.
Regression to the mean
There was temporal variation in state specific firearm mortality rates. If a state were to have a period of unusually high firearm mortality rates as part of this expected variation, lawmakers might have been stimulated to pass laws regulating handguns. Hence, any observed beneficial response of legislation may represent the natural tendency for mortality rates to regress to their mean rates.20 Similarly, a law may be observed to have an adverse effect if mortality rates were particularly low before its implementation. To evaluate whether regression to the mean might explain all or part of any statistically significant association of any law with firearm mortality, we compared the firearm mortality rate in the two year period before that law went into effect with previous years in the same state, adjusted as in all our analyses.
All data used were publicly available without identifiers, and thus the study was considered exempt from institutional review board review.
RESULTS
Temporal trends in mortality
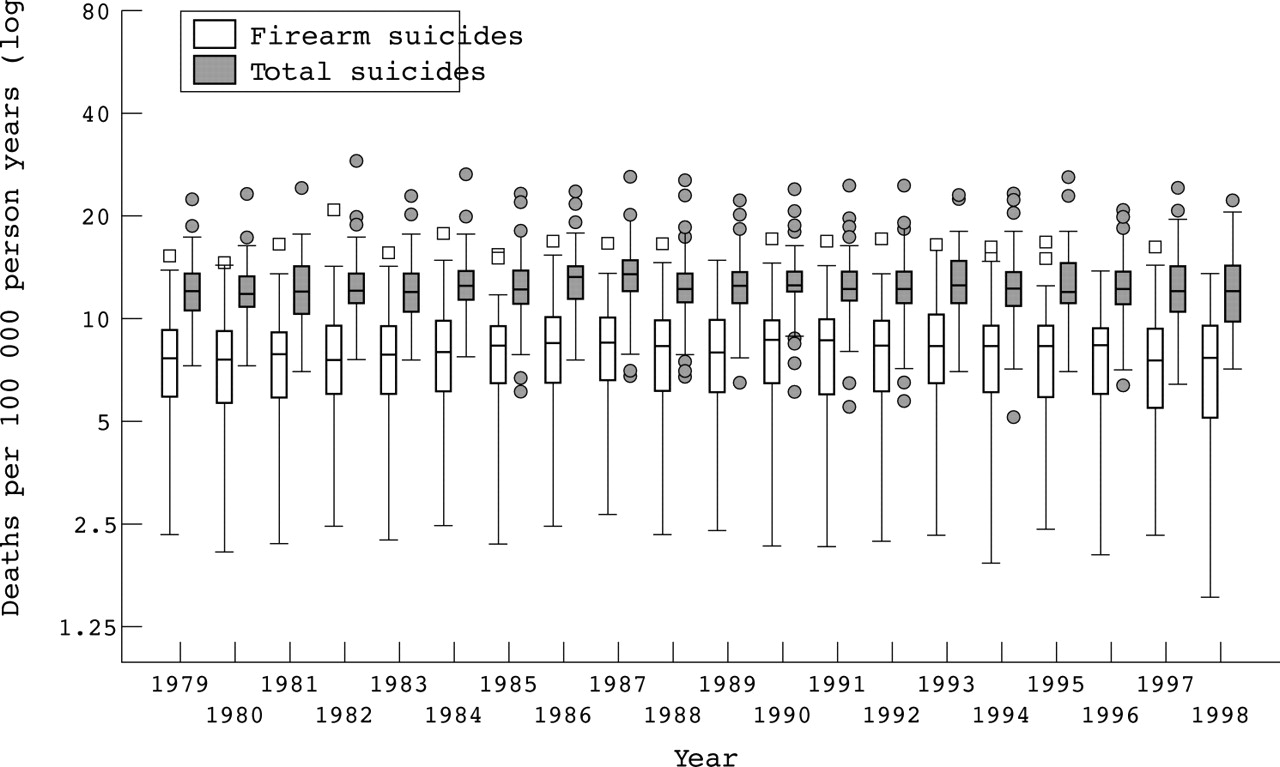
During the 20 years of the study, there were 442 702 homicide deaths, of which 289 719 (65%) were firearm related, and 596 704 suicides, of which 352 196 (59%) were firearm related (figs 1 and 2). Firearm homicide rates peaked at 7.1 per 100 000 person years in 1993, while total homicide rates peaked at 10.5 in 1980 and again at 10.4 in 1991. Firearm suicide rates peaked twice at 7.6 per 100 000 person years, once in 1986 and again in 1990; total suicide rates peaked at 12.9 in 1986. Mortality rates differed substantially between states; to display this we plotted the median mortality rate among the states with the interquartile range (figs 1 and 2).

Trends in firearm and total suicide rates, United States, 1979–98. Each box and whisker represents the range of state mortality rates for that year. Horizontal line indicates the median; box denotes the 25–75th percentile (IQR); whiskers indicate outer limits and extend to the last value before 1.5 × IQR past the 25th and 75th percentile; squares and circles indicate states exceeding outer limits.
Homicide rate ratios
There was little evidence of variation in state rate ratios with a minimum age of 21 years for private purchase law or a one gun a month law; p values for heterogeneity were not less than 0.38 and the I2 values did not exceed 7% (fig 3, table 2).
For the minimum age of 21 years for possession law, the I2 reached 39%. For “shall issue” laws the p values for tests of heterogeneity in rate ratios were statistically significant (p<0.001) and the I2 values were 86% and 85%. The observed homicide rate after passage of a “shall issue” law was lower in the period without the law (table 2). However, after adjusting for potential confounding and temporal trends in homicide rates, when a “shall issue” law was present, the rate of firearm homicides was greater than when it was not present, RR 1.11 (95% CI 0.99 to 1.24), as was the rate for all homicides, RR 1.07 (95% CI 0.98 to 1.17), although neither was statistically significant (table 2). Summarized across all states, no law was associated with a statistically significant decrease in the rates of firearm homicides or total homicides.
We found little evidence that regression to the mean might explain this association of a “shall issue” law and increased firearm homicide, as the firearm homicide rate in the two years before implementation of the shall issue law was nearly the same as in earlier years, RR 1.01 (95% CI 0.94 to 1.09).
Homicide rate ratios by age subgroups
The RRs for laws restricting the minimum age to 21 years for private purchase or possession varied little by age group; p values for a test that RRs varied by age group (younger than 20 years, 20 years or older), were all equal to or greater than 0.10 (table 3).
In all subgroups the RR estimates had 95% confidence intervals that included 1.
Suicide rate ratios
There was little evidence that state rate ratios varied with each law, except for the minimum age of 21 years for possession: p = 0.02 and I2 reached 64% (fig 4, table 4).
No law was associated with a statistically significant change in firearm suicide rates (table 4). A law that banned the sale of junk guns was associated with a decrease in total suicide rates, RR 0.86 (95% CI 0.77 to 0.96).
Suicide rate ratios by subgroups
The RRs for laws restricting the minimum age to 21 years for private purchase or possession varied little by age group; p values for a test that RRs varied by age group (younger than 20 years, 20 years or older), were all equal to or greater than 0.20 (table 3).
DISCUSSION
From 1979 to 1998 many states passed laws regulating handguns. Our analyses suggest that a “shall issue” law that eliminates most restrictions on carrying a concealed weapon does not confer a reduction in firearm homicide and may be associated with increased mortality rates. No law was associated with a statistically significant decrease in firearm homicide or suicide rates.
Due to the observational and ecological nature of this study, bias due to confounding may persist because of an inability to account for all risk factors that might distort the observed associations.21,22 However, the “shall issue” law was passed in many states, which are diverse in nature and represent all regions of the United States. In addition, the analysis was state specific, based upon a comparison within each state before and after each law took effect. Information from other states was only used to control for any national trend in mortality.
The increased firearm homicide rate observed after implementation of a “shall issue” law permitting nearly unrestricted carrying of concealed weapons was based upon an analysis of 23 states. Regression to the mean does not explain our observations, as the homicide rate in the two years preceding the law differed little from the rate in previous years within the same state.
Our results are in contrast to those of Lott and Mustard, who reported a 7.65% reduction in homicide rates associated with “shall issue” laws.5 This difference may stem from the additional 13 states that implemented a “shall issue” law during the period of our study. We have used dates of enactment similar to those of Lott and Mustard and of Ayres and Donohue.5,6 Even if we employ the coding scheme of Vernick, which identified different implementation dates for five states, we obtain a similar increase in firearm homicide with passage of a “shall issue” law, RR 1.10 (95% CI 0.98 to 1.23).23
Hence, differing statistical methods appear to account for most of the discrepancy. Lott and Mustard used weighted least squares linear regression to evaluate the association between the natural logarithm of homicide rates and passage of the law. Their regression aggregated all states, thereby assuming a similar impact of the law for each state in which it was implemented. However, the heterogeneity in state specific RRs after implementation of the law was substantial; the RRs for firearm homicide ranged from 0.53 to 2.71 (test of homogeneity, p<0.001), and 86% of this variation was due to heterogeneity beyond what was expected by chance. Donohue and Ayers reported similar state variation in the association between “shall issue’ laws and homicide rates. They emphasized that the aggregated estimate was more heavily influenced by earlier adopting jurisdictions, as they contributed more post-passage years to the analysis.6 In their disaggregated analysis of Lott’s data, 16 of the 23 states implementing a “shall issue” law observed an increase in murder, similar to the 15 noted in our study, and the population weighted fixed effects summary estimate was associated with a non-significant 0.6% increase in homicides.
We tried to account for this variation in state rate ratios by including state specific interactions and calculating state specific RRs. We also modeled time specific to each state by allowing temporal trends in homicide rates to vary between states through the inclusion of interactions terms between state and year. Finally, we used a random effects summary estimator to calculate a final law summary estimate, which gives more weight to smaller states compared with a fixed effects summary. Nevertheless, although the confidence intervals for the random effects summary rate ratios were appreciably greater than those from a fixed effects summary estimate, the rate ratios for random and fixed effects never differed by more than 0.01. If we assume a constant impact of the law across all adopting states and combine the states by removing the state-law interaction term and assume that temporal trends in mortality were the same for every state by removing the state-year interactions from our regression model, yet still employ a Poisson regression model with robust variance estimator and control for all the same demographic and socioeconomic covariates, we produce estimates similar to those of Lott and Mustard for firearm homicide, RR 0.95 (95% CI 0.91 to 1.00) and total homicide, RR 0.97 (95% CI 0.94 to 1.01). We believe these estimates are inaccurate because they fail to account for the variation in risk ratios across states and the variation between states in homicide rates over time.
No law was associated with a significant reduction in either firearm homicide or suicide rates. Similar to the recent study of Webster et al, we did not find significant evidence that laws restricting the minimum age for purchase or possession reduced either firearm suicide or homicide rates in youths, although our estimated rate ratios were all less than 1.8 These minimum age for purchase or possession laws, however, were amended in only nine and five states, respectively, for which only three and one state had at least five years of post-amendment data. This, in combination with the increase, albeit non-significant, in total suicides for either law, raises suspicion as to the validity of these observations. Alternatively, our results may stem from our assumption that the effect of each law was immediate and constant. A study of Maryland’s ban on “Saturday Night Specials” noted that estimates of the law effect on firearm homicide rates depended upon assumptions made about the timing of the law’s effect; assuming a delayed and gradual effect of the law best accounted for the variability in the data.7
Key points
-
There is disagreement regarding the effects of some laws regulating handguns on firearm mortality rates.
-
This ecological study observed considerable variation between states in the association of some laws regulating handguns with firearm homicide and suicide rates.
-
A “shall issue” law that permits the carrying of a handgun in an unrestricted fashion may be associated with an increase in firearm homicide rates.
-
Little evidence was observed that any of the laws evaluated were associated with a significant reduction in either firearm homicide or firearm suicide rates.
The junk gun statute, which was enacted in only one state, was associated with a statistically significant 14% reduction in all suicide deaths. However, the reduction in firearm suicide deaths associated with this law was only 8%. It does not seem plausible to us that this law would reduce suicide deaths by means other than a gun, and therefore we suspect that the association between this policy and all suicides is not likely to be causal.
Our analysis was restricted to states that had passed any of the laws under study. Had smaller jurisdictions within these states passed similar laws before statewide implementation, then our analysis might underestimate any effect. Similarly, if any city or town passed these laws without statewide implementation or if passage of these laws affected gun accessibility in surrounding states without the law, then our analysis might also underestimate any effect. Finally, if any city or smaller ordinance passed the law after state enactment, we might be simultaneously measuring the effects of these local statutes.
Year of statute implementation, United States, 1979–98
Homicides in states with a change in the law, United States, 1979–98*
Rate ratios for homicide and suicide rates post-law compared with pre-law by age group, United States, 1979–98*
Suicides in states with a change in the law, United States, 1979–98*

Trends in firearm and total homicide rates, United States, 1979–98. Each box and whisker represents the range of state mortality rates for that year. Horizontal line indicates the median; box denotes the 25–75th percentile (interquartile range (IQR)); whiskers indicate outer limits and extend to the last value before 1.5 × IQR past the 25th and 75th percentile; squares and circles indicate states exceeding outer limits.
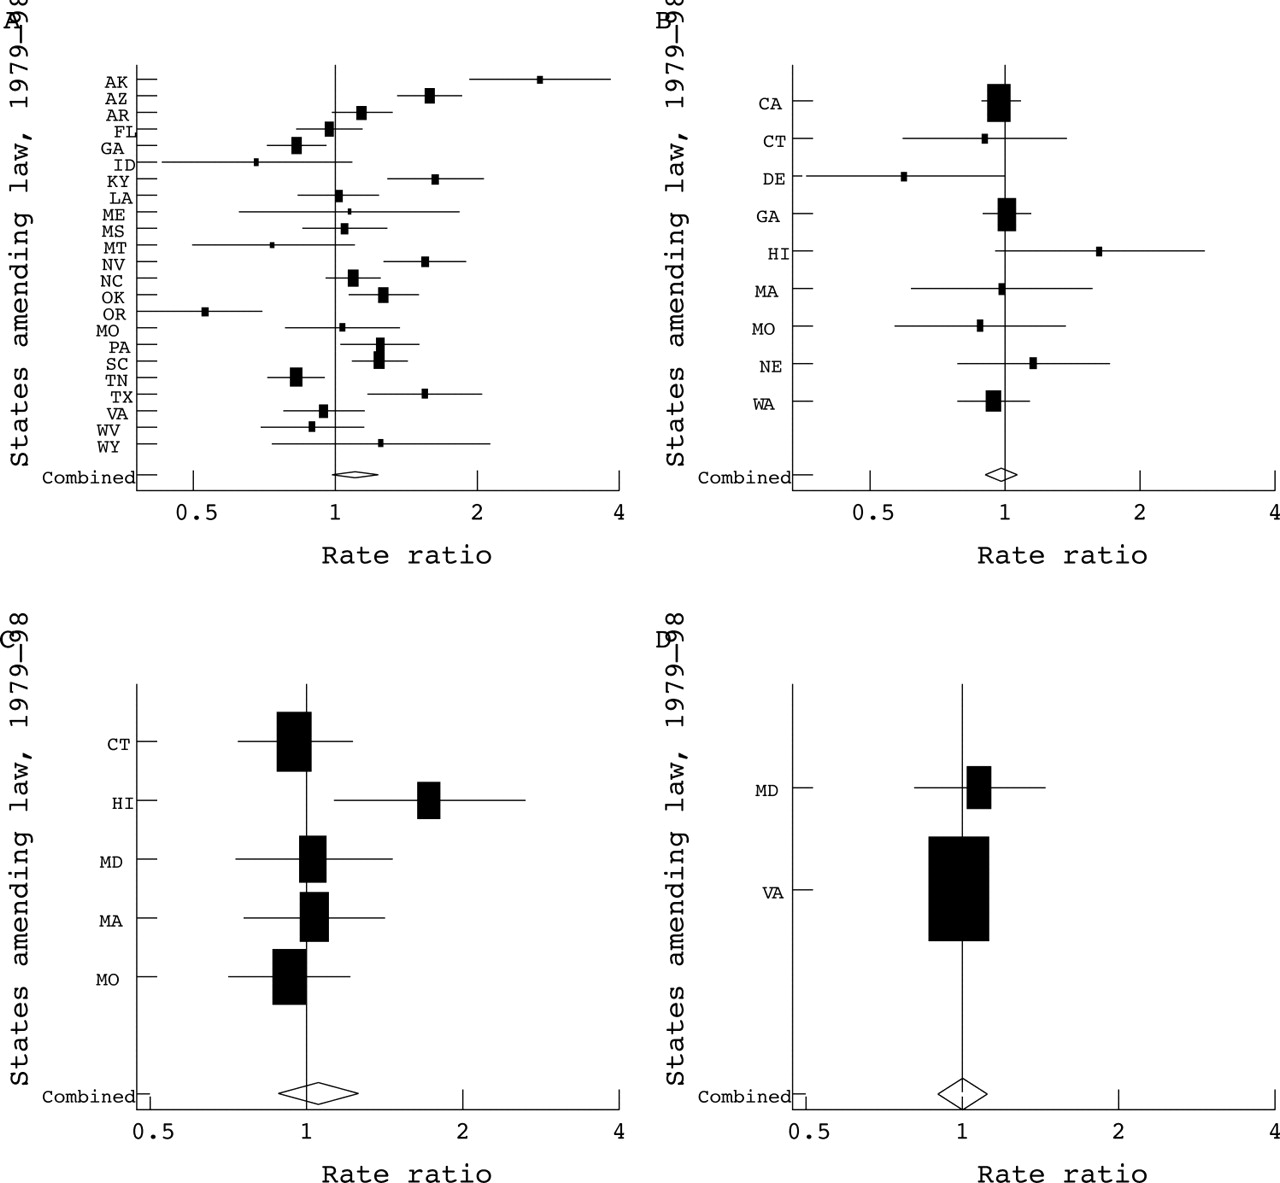
State mortality rate ratio: firearm homicide, United States, 1979–98. (A) “Shall issue” law; (B) minimum age of 21 years for private purchase; (C) minimum age of 21 years for private possession; (D) one gun a month law. States enacting the law during the study period are represented on the ordinate. Boxes indicate state rate ratio. Box size is proportional to the inverse variance of each state rate ratio. Lines indicate 95% confidence interval. Diamond indicates random effects summary estimate of mortality rate ratio.

State mortality rate ratio: firearm suicide, United States, 1979–98. (A) “Shall issue” law; (B) minimum age of 21 years for private purchase; (C) minimum age of 21 years for private possession; (D) one gun a month law. States enacting the law during the study period are represented on the ordinate. Boxes indicate state rate ratio. Box size is proportional to the inverse variance of each state rate ratio. Lines indicate 95% confidence interval. Diamond indicates random effects summary estimate of mortality rate ratio.
REFERENCES
Footnotes
-
Competing interests: the authors declare no competing interests.