Article Text

Abstract
Background Traumatic brain injury (TBI) is a leading cause of morbidity and mortality. There are currently no cytoprotective treatments for TBI. There is growing evidence that the histone deacetylase inhibitor valproic acid (VPA) may be beneficial in the treatment of TBI associated with hemorrhagic shock and in isolation. We sought to further evaluate the mechanistic underpinnings of this demonstrated efficacy via proteomic analysis of injured brain tissue.
Methods Swine were subjected to TBI via controlled cortical impact, randomized to treatment with VPA or control and observed for 6 hours. The brains of the pigs were then sectioned, and tissue was prepared and analyzed for proteomic data, including gene ontology (GO), gene-set enrichment analysis and enrichment mapping, and network mapping.
Results Proteomic analysis demonstrated differential expression of hundreds of proteins in injured brain tissue after treatment with VPA. GO analysis and network analyses revealed groups of proteins and processes that are known to modulate injury response after TBI and impact cell fate. Processes affected included protein targeting and transport, cation and G-protein signaling, metabolic response, neurotransmitter response and immune function.
Discussion This proteomic analysis provides initial mechanistic insight into the observed rescue of injured brain tissue after VPA administration in isolated TBI.
Level of evidence Not applicable (animal study).
- TBI
- valproic acid
- cytoprotection
- histone deacetylase inhibitors
This is an open access article distributed in accordance with the Creative Commons Attribution Non Commercial (CC BY-NC 4.0) license, which permits others to distribute, remix, adapt, build upon this work non-commercially, and license their derivative works on different terms, provided the original work is properly cited, appropriate credit is given, any changes made indicated, and the use is non-commercial. See: http://creativecommons.org/licenses/by-nc/4.0/.
Statistics from Altmetric.com
Introduction
Traumatic brain injury (TBI) is a leading cause of morbidity and mortality for young Americans. It is responsible for nearly 3 million emergency department visits, hospitalizations and deaths combined annually.1 2 It also has been recognized as a hallmark injury of the wars in Afghanistan and Iraq.3 However, despite its devastating and widespread impact, all options for the management of TBI are supportive in nature. There are currently no clinically approved cytoprotective treatment strategies that can decrease the extent of brain damage, limit disability and improve survival in patients affected by TBI.4
One potential TBI treatment strategy could employ valproic acid (VPA). VPA is a histone deacetylase inhibitor (HDACi) widely used in the treatment of seizures. As an HDACi, VPA selectively increases acetylation of proteins such as histones, inducing conformational changes in chromatin structure and thereby augmenting the expression of key genes and proteins. VPA has been shown to decrease injury lesion size after TBI, decrease lesion size and improve neurologic recovery after combined TBI and hemorrhagic shock (HS).5–7 Transcriptomic analyses of injured brain tissue and peripheral blood mononuclear cells (PBMCs) demonstrated VPA’s efficacy in altering expression of genes critical for determining cell fate.8–10 However, although TBI associated with hemorrhage and polytrauma is a common injury pattern in combat theatres, isolated TBI without extracranial injuries is more common in civilian settings.11 Recent data demonstrate VPA also rescues injured tissue in an isolated TBI injury pattern.12 Analysis of possible protein changes induced by VPA in injured brain tissue has been limited, especially in the isolated TBI injury pattern. Thus, little is currently known about the mechanisms underlying the observed beneficial effects of VPA in isolated TBI.
The use of VPA for the treatment of isolated TBI is an emerging area of investigation. Further evaluation of mechanistic causes of VPA’s effects on injured brain tissue is needed to fully understand its actions and delineate the role it may have in the treatment of TBI. The aim of this study is to address this knowledge gap and evaluate proteomic changes in brain tissue after TBI. We hypothesized that proteomic evaluation of brain tissue treated with VPA after TBI would reveal affected pathways that are critical for injury response and cell fate.
Materials and methods
Animal protocol
We adhered to the Animal Welfare Act Regulations and other Federal statutes relating to animals and experiments involving animals and the principles set forth in the current version of the National Institutes of Health Guide for Care and Use of Laboratory Animals, National Research Council. Female Yorkshire swine between 40 and 44 kg were used for the experiments (Michigan State University, East Lansing, MI). Details of the animal protocol have been described previously.12 Briefly, swine were placed under general anesthesia and mechanically ventilated for the entire experiment. A craniotomy was made to expose the dura anterolateral to the bregma. A controlled cortical impact device inflicted the TBI on the exposed dura using a 20 mm diameter impactor, at 4 m/s velocity, with 100 ms dwell time and a depth of 12 mm. One hour after TBI, animals were randomized to a normal saline vehicle (control group; n=4) or 150 mg/kg VPA delivered intravenously via a peripheral ear vein over 1 hour (VPA group; n=4). Seven hours after TBI, animals were killed with a barbiturate overdose (Euthasol; Virbac, Fort Worth, TX). The brain was removed en bloc and placed into a titanium sectioner to make 5 mm thick coronal sections. The most grossly injured section was selected, and the hemisphere ipsilateral to the injury was cut into eight radially symmetric pieces. The piece of tissue immediately inferior to the most destroyed tissue section was selected and snap frozen to be used later for proteomics analysis.
Proteomics
Sample preparation
Each sample was homogenized in modified radioimmunoprecipitation assay buffer (2% sodium dodecyl sulphate, 150 mM NaCl and 50 mM Tris pH8). Protein extraction was performed by mechanical disruption using 1.6 mm stainless steel beads in a Bullet Blender (Next Advance, Troy, NY). Samples were incubated at 60°C for 30 min and clarified by centrifugation. Tissue extracts were subjected to trichloroacetic acid (TCA) precipitation.13 Washed protein pellets were solubilized in 300 µL of urea buffer (8M urea, 150 mM NaCl, 50 mM Tris pH8, 1× Roche complete protease inhibitor). Protein quantitation was performed using Qubit fluorometry (Invitrogen, Carlsbad, CA).
Protein digestion
Thirty micrograms of each sample was digested with the following protocol: (1) reduced with 15 mM dithiothreitol at 25°C for 30 min followed by alkylation with 15 mM iodoacetamide at 25°C for 45 min in the dark. (2) Digested with 2.5 µg sequencing grade trypsin (Promega) at 37°C overnight. The final digest volume was 0.5 mL adjusted with 25 mM ammonium bicarbonate. (3) Digests were cooled to room temperature and terminated with 5 µL of formic acid. The digests were centrifuged at 10 000 g for 10 min and desalted using an Empore SD solid phase extraction plate (3M, Eagan, MN). (4) Samples were lyophilized and reconstituted in 0.1% trifluoracetic acid for analysis.
Mass spectrometry
Two micrograms of each digested sample was analyzed by nano liquid chromatography-tandem mass spectrometry (LC-MS/MS) with a M-Class high-performance liquid chromatography system (Waters, Milford, MA) interfaced to a ThermoFisher Fusion Lumos mass spectrometer (Waltham, MA). Peptides were loaded on a trapping column and eluted over a 75 µm analytical column at 350 nL/min; both columns were packed with Luna C18 resin (Phenomenex, Torrance, CA). A 3-hour gradient was employed. The mass spectrometer was operated in data-dependent mode, with the Orbitrap operating at 60 000 full width at half maximum (FWHM) and 15 000 FWHM for MS and MS/MS, respectively. Advanced peak determination was enabled, and the instrument was run with a 3 s cycle for MS and MS/MS.
Data analysis
Data were searched using a local copy of Mascot (Matrix Science, Boston, MA) with the following parameters: (1) enzyme: trypsin/P; (2) database: UniProt Pig (concatenated forward and reverse plus common contaminants); (3) fixed modification: carbamidomethyl (C). (4) Variable modifications: oxidation (M), acetyl (N-term), pyro-glu (N-term Q), deamidation (N/Q). (5) Mass values: monoisotopic. (6) Peptide mass tolerance: 10 ppm. (7) Fragment mass tolerance: 0.02 Da. (8) Maximum missed cleavages: 2.
Mascot DAT files were parsed into Scaffold (Proteome Software) for validation, filtering and to create a non-redundant list per sample. Data were filtered using at 1% protein and peptide false discovery rate and requiring at least two unique peptides per protein. The full protein list with total spectral counts was exported to excel for fold change calculations and t-tests. The fold change was calculated from the normalized spectral abundance factor (NSAF), specifically the average NSAF values for each sample category were compared. The NSAF was calculated as follows: NSAF=(SpC/MW)/Σ(SpC/MW)N, where SpC=spectral counts, MW=protein molecular weight in kDa and N=total number of proteins.14 A two-tailed, paired t-test was performed.
Gene ontology (GO) enrichment
Subsequently GO analysis was performed using the iPathway Guide (Advaita Bioinformatics, Plymouth, MI) with minimum thresholds of p<0.05 and fold change of at least 1.5 (log2 fold change 0.6). P values were adjusted using false discovery rate for multiple comparisons. GO terms described the highest ranked biological processes and molecular functions in the context of terms from the Gene Ontology Consortium database.15 For each GO term, differentially expressed (DE) proteins from the proteomics analysis were compared with the number of DE proteins expected by chance. Elim pruning p values correction was used for iterative elimination of proteins mapped to a significant GO term from more general GO terms.16 We set a minimum of five DE expressed genes for each GO term.
Gene-set enrichment analysis (GSEA) and enrichment mapping (EM)
To easier visualize commonalities among pathways, network visualization was performed. Significantly, DE proteins were ranked according to log-fold change and p value for GSEA. Proteins were ranked according to log-fold change and p value [sign(log(Fold Change))*(−log10(p value))], and GSEA was performed using 2000 permutations and the May 2020 GO derived gene set from the Bader Lab.17 The enriched gene sets were imported into the EM plugin in Cytoscape (V.3.8) with p value <0.05.18 The largest network was then selected for easier visualization of individual nodes.
Network mapping
To easier visualize commonalities among pathways, network visualization was performed. Significant DE proteins were ranked according to p value, and g:Profiler was used to identify enriched biologic pathways with a p value <0.05 from the manually annotated Reactome database.19–21 The enriched gene sets were imported into the EM plugin in Cytoscape (V.3.7.1) with p value <0.05 and false discovery rate with q value <0.05.18 Nodes that did not contribute to a larger network were removed. Networks were identified and clustered; individual node labels were removed, and clusters were manually annotated for easier visualization.
Results
Protein differential expression
Five hundred and twenty-three proteins were DE with VPA treatment compared with controls (p<0.05). The complete list of proteins is in online supplemental table S1. The volcano plot illustrates ranking of proteins based on their significance (figure 1).
Supplemental material
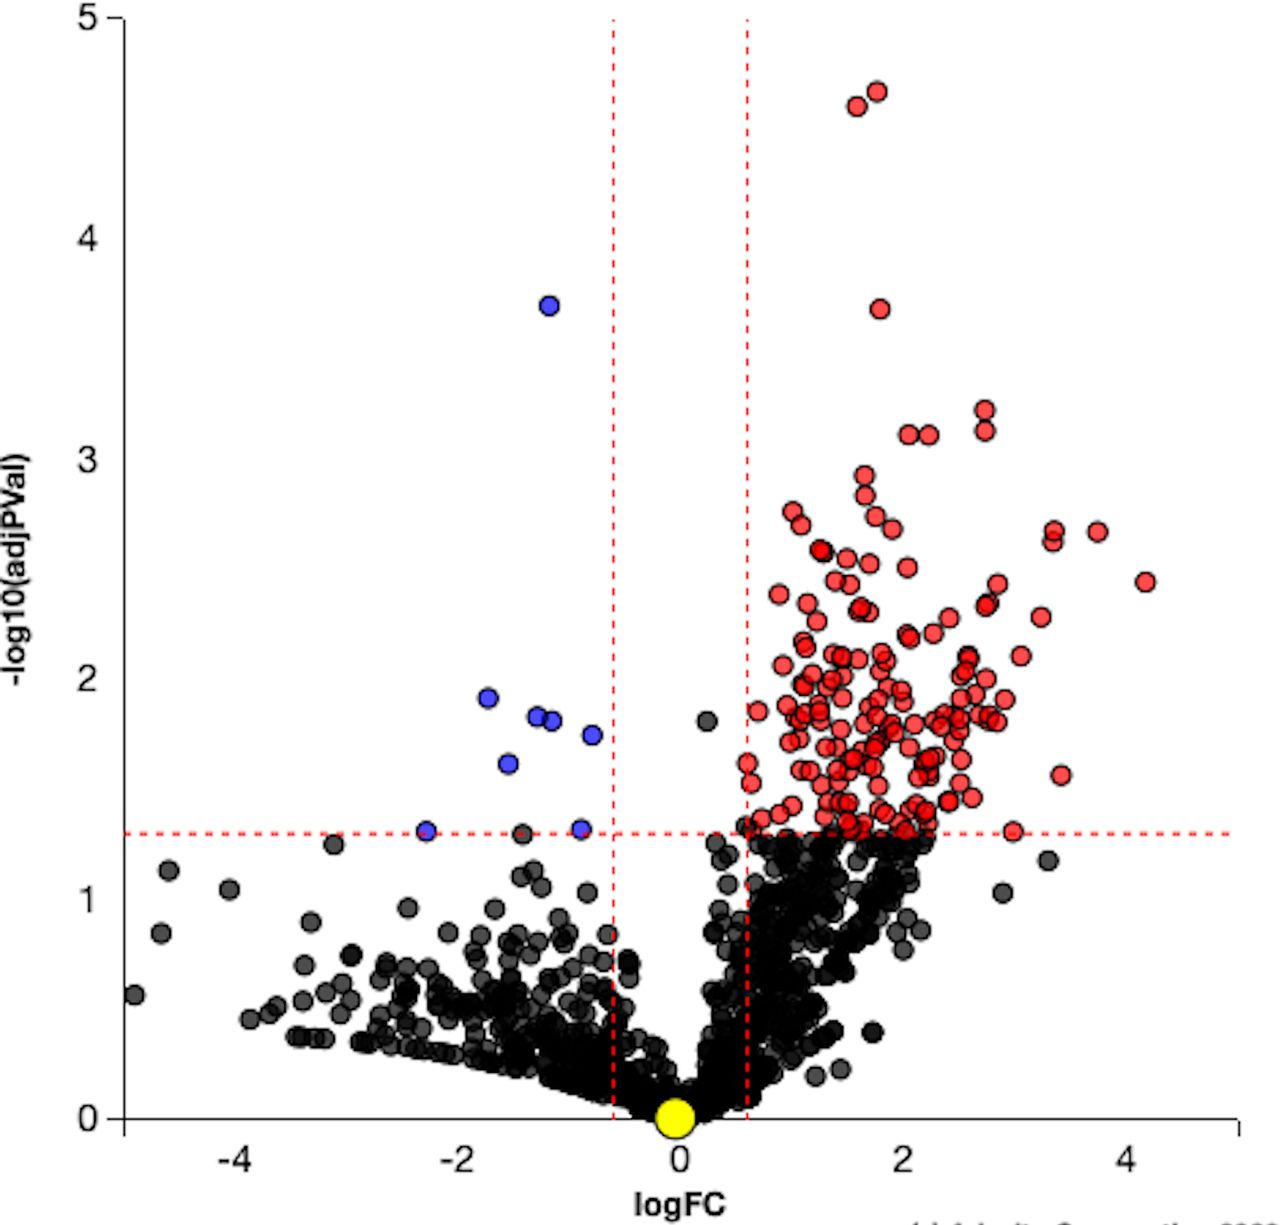
Volcano plot. Differentially expressed (DE) proteins are represented in terms of their measured significance of the change (y-axis) and the expression change (x-axis). Dotted lines represent the thresholds used to select the DE genes: 0.6 for expression change and 0.05 for p value. The upregulated proteins (positive log fold change) are shown in red, whereas the downregulated genes are blue. Insignificant proteins are shown in black.
GO enrichment
One hundred and ninety-six GO terms for biological processes were significantly enriched with uncorrected p values. Elim pruning and threshold restrictions yielded 25 GO terms for biological processes that were significantly enriched (table 1). Sixty-six GO terms for molecular functions were significantly enriched with uncorrected p values. Elim pruning and threshold restrictions yielded 22 enriched molecular functions (table 2).
Gene ontology (GO) biologic processes significantly enriched after valproic acid treatment
Gene ontology (GO) molecular functions significantly enriched after valproic acid treatment
Protein:protein interaction
Using the DE genes from significant biologic processes and molecular functions, a protein:protein interaction network was constructed to search for hub proteins (figure 2A). Ninety-four proteins contributed to a larger network. The central suite of the protein:protein interaction revealed a highly connected core of proteins (figure 2B). Apolipoprotein B was at the center and contributed to three main groups of proteins: clathrin coated vesicle transport (CLTCL1, AP2A1, AP2A2, AP2B1, AP2S1 and RAB5b), actin binding polymerization (ARPC1A, ARPC3 and ARPC2) and protease inhibitors (ITIH2, SERPIND1 and KNG1). Other proteins in the central suite include a large group of ribosomal subunits (RPS4X, RPS3A, RPLP1, RPS16, RPL14, RPL10A, RPL10 and RPL13).

(A) Broad perspective of protein:protein interaction showing clusters of highly connected subnetworks of interconnected proteins. (B) Zoomed perspective of protein:protein interaction showing central suite of largest network. The higher the number of connections, the closer to the center The gene will be drawn. Blue indicates a downregulated differentially expressed (DE) protein, and red indicates an upregulated DE protein. A, activation; B, binding; C, catalysis; R, reaction.
Gene set enrichment analysis
GSEA revealed VPA treatment 303 gene sets were significantly upregulated, and 18 gene sets were downregulated with a nominal p value <0.05. EM revealed a large network upregulated involved in RNA transcription and protein translation; this largest network was selected for easier visualization of individual nodes (figure 3). Gene sets enriched also included upregulation in transmembrane transport, tricarboxylic acid (TCA) cycle, cell-to-cell adhesion, lipid transport, neurotransmitter transport, ATPase coupled ion transport and corticotropin-releasing hormone signaling. Proteasomal catabolic processes were downregulated after VPA treatment.
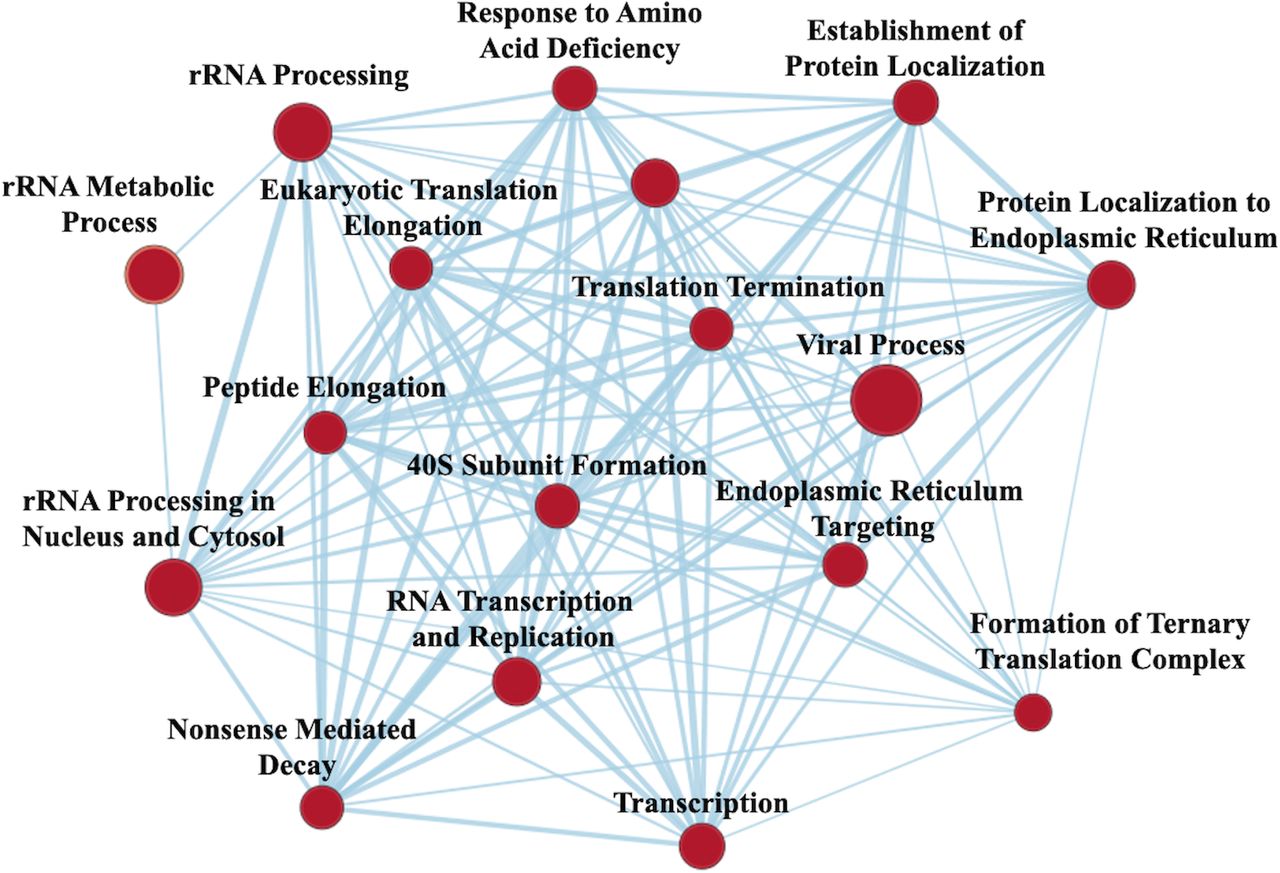
Enrichment map from gene set enrichment analysis) illustrating networks of significantly enriched gene sets from proteomic analysis. Node size represents the number of genes in the gene set; edge thickness is proportional to the overlap between gene sets; red represents upregulation with valproic acid treatment.
Network analysis
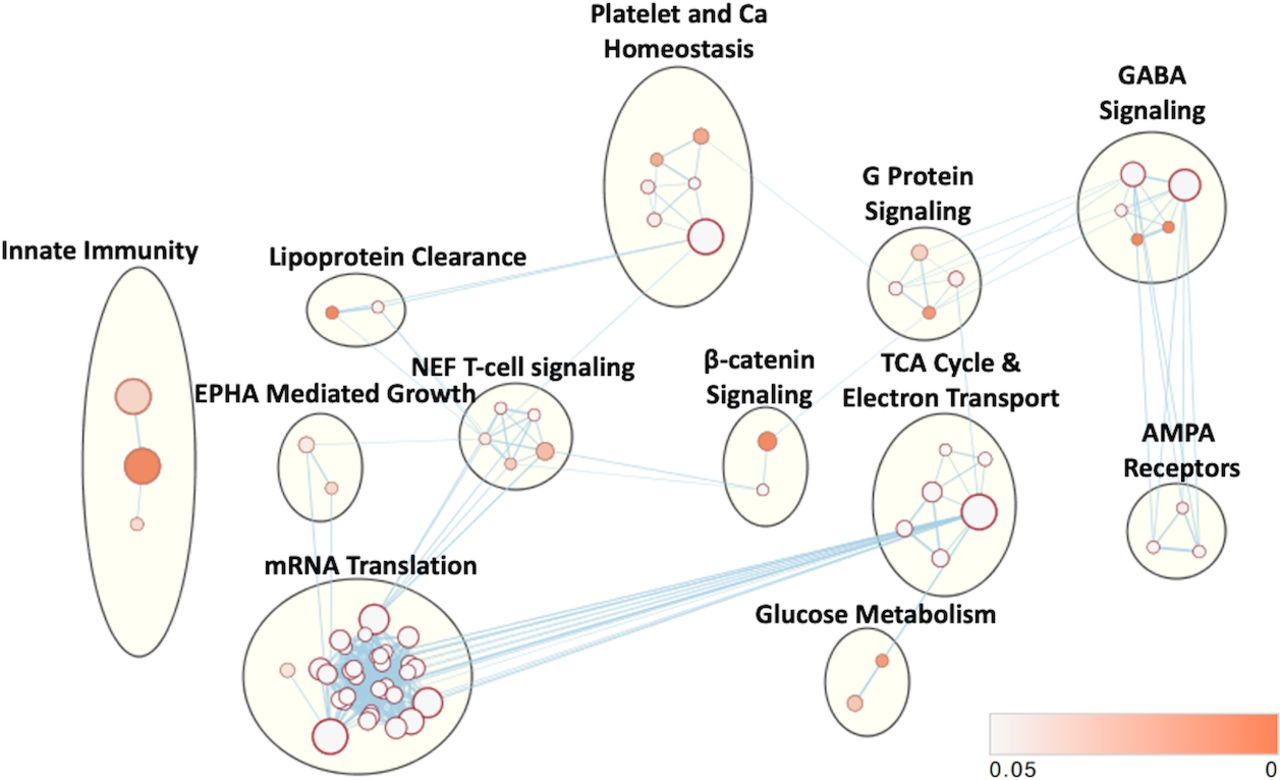
Pathway enrichment analysis revealed 73 enriched pathways with a p value <0.05. EM revealed 12 dominant clusters (figure 4). The largest network upregulated was involved in RNA transcription and protein translation. Networks enriched with VPA treatment also included aerobic metabolism, calcium signaling and platelet homeostasis, gamma aminobutyric acid (GABA) signaling, Nef-mediated T cell signaling, G-protein signaling, α-amino-3-hydroxy-5-methyl-4-isoxazolepropionic acid (AMPA) receptors (glutamate-mediated calcium signaling), innate immunity, beta-catenin signaling, Ephrin A (EPHA)-mediated growth (regulates actin cytoskeleton), glucose metabolism and lipoprotein clearance.

Cellular networks affected by VPA treatment. Enriched gene sets based on differentially expressed proteins and subsequent enrichment analysis mapped into common clusters. Nodes represent pathways and edges represent overlapping genes. Increasing node size represents increased number of proteins contributing to that pathway. Increasing edge thickness represents increased overlap between pathways. Node darkness corresponds to decreasing p value according to legend in bottom right. VPA, valproic acid.
Discussion
The results of this study demonstrate that administration of VPA after isolated TBI is associated with DE of hundreds of proteins. Moreover, GO analysis and network analyses revealed groups of proteins and processes that are known to modulate injury response after TBI and impact cell fate. Important processes affected include protein targeting and transport, Ca2+ and other cation signaling, metabolic response, G-protein signaling, neurotransmitter response and immune function among others. This study describes changes that occur with VPA treatment after TBI in the injured tissue and helps to explain the cytoprotective effect to rescue injured brain tissue after TBI.12
This article builds on other high throughput transcriptomic and proteomic data analyzing VPA treatment after injury.8 9 22 23 As discussed above, previous injury models have included HS with or without other severe extracranial injuries. However, this study only included an isolated TBI insult. Hemorrhage is well known to exacerbate TBI.24 Therefore, it was unknown what variable effect VPA could have on TBI outside of a context involving HS as an injury modulator. Furthermore, some of the previous transcriptomic and proteomic analyses of TBI after injury have used PBMCs as an accessible tissue sample, instead of the injured brain. To our knowledge, this is the first proteomic analysis directly on the injured brain tissue after TBI. Despite the differences between technique, injury pattern and tissue sampled, there still are similar themes between these previous studies and this current study regarding the effect of VPA after TBI. These include identifying similar processes affected such as neurotransmission and synaptic function,9 ion channels and transport,9 protein translation and cell growth,8 22 23 and GTPase signaling cascades.22 Importantly, some of these protein changes are translatable to humans. For example, similar changes related to cell growth and survival are observed in healthy human volunteers after similar doses of VPA.25 26
Many of these identified biological processes and molecular functions are known to impact the response to injury and impact cell survival. Neurotransmitter and synaptic function along with ion signaling were consistently found to be modulated by VPA. Both of these processes contribute to the overall excitability of neurons and are especially important after TBI. Glutamate is the primary excitability neurotransmitter (in contrast to GABA), and glutamate leads to the influx of high levels of Ca2+ into the cell. The early release of glutamate after TBI contributes to excitotoxicity and cell death and dysfunction.27 Early after TBI, injured neurons are particularly sensitive to glutamate stimulation.28 Our data suggest that VPA treatment leads to a more dampened response to glutamate and Ca2+, which would likely in turn explain some of the cytoprotective effect of VPA in the setting of TBI. These data are concordant with other pharmacodynamic studies highlighting that VPA can block excitatory voltage gated ion channels and is overall GABAergic when used as an antiepilepsy drug.29 Other well-studied processes that were highlighted in our proteomic analysis include the metabolic response after TBI. The ‘metabolic crisis’ that occurs after TBI is known to contribute to ongoing cell death and is highlighted by a high lactate to pyruvate ratio, indicating a relative unmet need for oxidative metabolism.30 31 Here we found numerous GO processes and functions upregulated that contribute to both the Tricarboxylic acid cycle and mitochondrial metabolism including the electron transport chain and ATP synthesis. Increasing the capacity to meet increased metabolic needs after TBI could also explain reasons for the previously observed cytoprotective effect of VPA. Finally, we again found many proteins that are critical parts of the translational machinery in this proteomic analysis as highlighted by the large suite of ribosomal subunits in the protein:protein interaction network and GSEA and network analyses, and ribosomes are known to be key players in translational homeostasis that regulates cell fate after injury.32 This is very consistent with previous data and contributes to pathways such as cell growth and differentiation signaling creating a general shift away from cell death and toward cell survival.
This study was primarily limited by two factors. First, the proteome of Yorkshire swine is not yet fully characterized. Accordingly, in this study, roughly one-third of the proteins identified as DE between pigs treated with VPA and control animals could not be identified or their function described. Thus, this proteomic description of the effects of VPA is not exhaustive. Second, the sample size of this study was small. This was primarily because significant differences were seen in this small number. Both of these limiting factors are consequences of using a large animal, such as a pig, as a model organism rather than a small rodent model. However, the results from this large animal study are more likely to be translatable to humans, as pigs are known to model the human anatomic and physiologic response to TBI well.33–35
Overall, the demonstration of cytoprotective proteomic changes after VPA administration in this study provides important mechanistic insight for the previously shown rescue of injured brain tissue in isolated TBI. These results further underscore the potential of VPA as a possible treatment that could decrease the extent of brain damage, limit disability and improve survival in patients affected by TBI. Such knowledge can help to inform future clinical trials for VPA treatment after isolated TBI and monitor proteomics in such a trial for treatment effect in accessible tissues such as PBMCs.
References
Supplementary materials
Supplementary Data
This web only file has been produced by the BMJ Publishing Group from an electronic file supplied by the author(s) and has not been edited for content.
Footnotes
Contributors LP, HA and BEB contributed to experimental design. All authors contributed to data collection and analysis and drafting of the article.
Funding This study was funded by a grant from the Massey TBI Foundation. In addition, BEB was supported by the National Institute of General Medical Sciences of the National Institutes of Health under Award Number F32GM130010.
Competing interests None declared.
Patient consent for publication Not required.
Ethics approval All animal protocols were approved by the University of Michigan Institutional Animal Care & Use Committee.
Provenance and peer review Not commissioned; externally peer reviewed.
Data availability statement All data relevant to the study are included in the article or uploaded as supplementary information. Relevant dataset is included as a supplementary table.