Article Text

Abstract
Background The American College of Surgeons Needs Based Assessment of Trauma Systems (NBATS) tool was developed to help determine the optimal regional distribution of designated trauma centers (DTC). The objectives of our current study were to compare the current distribution of DTCs in Georgia with the recommended allocation as calculated by the NBATS tool and to see if the NBATS tool identified similar areas of need as defined by our previous analysis using the International Classification of Diseases, Ninth Revision, Clinical Modification Injury Severity Score (ICISS).
Methods Population counts were acquired from US Census publications. Transportation times were estimated using digitized roadmaps and patient zip codes. The number of severely injured patients was obtained from the Georgia Discharge Data System for 2010 to 2014. Severely injured patients were identified using two measures: ICISS<0.85 and Injury Severity Score >15.
Results The Georgia trauma system includes 19 level I, II, or III adult DTCs. The NBATS guidelines recommend 21; however, the distribution differs from what exists in the state. The existing DTCs exactly matched the NBATS recommended number of level I, II, or III DTCs in 2 of 10 trauma service areas (TSAs), exceeded the number recommended in 3 of 10 TSAs, and was below the number recommended in 5 of 10 TSAs. Densely populated, or urban, areas tend to be associated with a higher number of existing centers compared with the NBATS recommendation. Other less densely populated TSAs are characterized by large rural expanses with a single urban core where a DTC is located. The identified areas of need were similar to the ones identified in the previous gap analysis of the state using the ICISS methodology.
Discussion The tool appears to underestimate the number of centers needed in extensive and densely populated areas, but recommends additional centers in geographically expansive rural areas. The tool signifies a preliminary step in assessing the need for state-wide inpatient trauma center services.
Level of evidence Economic, level IV.
- trauma systems
- assessment tool
This is an open access article distributed in accordance with the Creative Commons Attribution Non Commercial (CC BY-NC 4.0) license, which permits others to distribute, remix, adapt, build upon this work non-commercially, and license their derivative works on different terms, provided the original work is properly cited, appropriate credit is given, any changes made indicated, and the use is non-commercial. See: http://creativecommons.org/licenses/by-nc/4.0
Statistics from Altmetric.com
Introduction
The components of an ideal trauma system include prevention, access, prehospital care, acute hospital care, rehabilitation, and research. The hospital component may further be categorized as levels I to IV trauma centers that provide life-saving trauma care in an inclusive network.1 The American College of Surgeons Committee on Trauma (ACS-COT) Resources for Optimal Care of the Injured Patient, currently called the “orange book,” defines the requirements for each level, including the volume of patients with major injuries for level I centers.2 The development of these trauma centers, however, can be very expensive, and if concentrated in a small geographic area may negatively impact the volume of patients with major injuries seen at each center.3 4 According to the orange book, the designating authority should be responsible for determining the optimal number and level of trauma centers in the region based on the expected volume of trauma patients and resources. Historically, a guideline or tool did not exist that could provide guidance to the lead agencies in making these assessments. Therefore, in 2015, the ACS-COT convened a Needs Based Trauma Center Designation Consensus Conference to develop the Needs Based Assessment of Trauma Systems (NBATS) tool with the objective of providing a “practical tool, based upon data that is currently available, that can be used to assist regions” in determining the optimal number of designated trauma centers (DTCs) based on the needs of the population served.5
Prior to the availability of the NBATS tool, Georgia undertook a similar project to identify areas in need of trauma centers using the International Classification of Injury Severity Score (ICISS).6 Through this gap analysis, the rural southern regions of the state were identified as areas of need for additional trauma centers. The objectives of our current study were to compare the current distribution of DTCs in Georgia with the recommended allocation as calculated by the NBATS tool and to see if the NBATS tool identified similar areas of need as defined by our previous ICISS analysis.
Methods
The NBATS tool guidelines were acquired from the ACS-COT website (https://www.facs.org/quality-programs/trauma/tscp/nbats). The NBATS tool is composed of six criteria with points given or subtracted for each criterion:
Population (2–10 points).
Median transport times (0–4 points).
Lead agency/system stakeholder/community support (0–5 points).
Severely injured patients discharged from acute care facilities not designated as level I, II, or III trauma centers (0–4 points).
Level I, II, or III trauma centers (negative points per center).
Number of severely injured patients seen in trauma centers (level I and II) already in the trauma service area (TSA) (range depends on the expected number seen at DTC).
“The final score provides a guideline for the number of trauma centers needed in the TSA.”5
Population data for the analysis were obtained from US Census counts and annual current population survey publications.7 The median transport time data were acquired from Google digitized roadmaps based on the center of the patient’s residence zip code as the starting point and the treating facility’s street address as the endpoint. In each case, the shortest calculated route was assumed to be the one used. The estimated transportation time assumes optimal traffic conditions (ie, no traffic). Actual driving times will vary, for example, by the time of day and weather conditions. It is also noteworthy that the calculated driving times are one-way and do not include the time required for emergency medical services (EMS) personnel to reach the patient before transporting him/her to the hospital. The median transport times were calculated for two groups of patients for 2014 and the 2010 to 2014 period. First, the median times were calculated including all patients treated at an acute care facility in the associated TSA regardless of their residence status. This definition includes potential travelers who happen to be outside their residence TSA at the time of their injury. However, because travel time calculation was based on the residence zip code, this measure likely overestimates actual travel times. The second measure included only patients who resided in the TSA where they were treated. This resulting travel time estimate is assumed to be more reliable as it avoids the problem of traveling patients being injured in another TSA.
Patient-level data were obtained from the Georgia Department of Public Health, Georgia Discharge Data System covering 5 years from 2010 to 2014. Potential trauma patients treated at both DTC and non-DTC were identified using the International Classification of Diseases, Ninth Revision, Clinical Modification (ICD-9-CM) codes ranging from 800 to 959.9, with the following exclusions: late effects from injuries—ICD-9-CM codes 905–909; superficial injuries and contusions only injuries—ICD-9-CM codes 910–924; dislocations and sprains—ICD-9-CM codes 830–848; foreign bodies entering through orifice—ICD-9-CM codes 930–939; and isolated femoral neck fractures in the elderly—ICD-9-CM code 821.
Two methods, the Injury Severity Score (ISS) method and the ICD-9-CM Injury Severity Score (ICISS) method, were employed in the analysis regarding injury severity scoring. The NBATS tool in its present form uses the ISS method to quantitate injuries. We, however, had previously evaluated our state using the ICISS method, and therefore used both methods to compare our results.6 ICISS were calculated using survival risk ratios (SRRs) compiled from a moving window of 5 years preceding the year in question to avoid same-year bias. For example, for the 2010 calendar year, ICISS values were derived from SRRs compiled from the 2005 to 2009 data. The ICISS methodology was developed by Osler et al 8 as an alternative to anatomic-derived measures. Unlike the alternatives, the ICISS is continuous and bounded by zero and one. High ICISS values indicate lower severity allowing classification of injuries, ranging from no probability of mortality (ICISS=1) to life-threatening (ICISS=0). Following existing peer-reviewed literature on the subject, severely injured patients were identified as having ICISS <0.85.9–12 Where reliant on injury severity, the analysis was repeated using the alternative ISS method.13
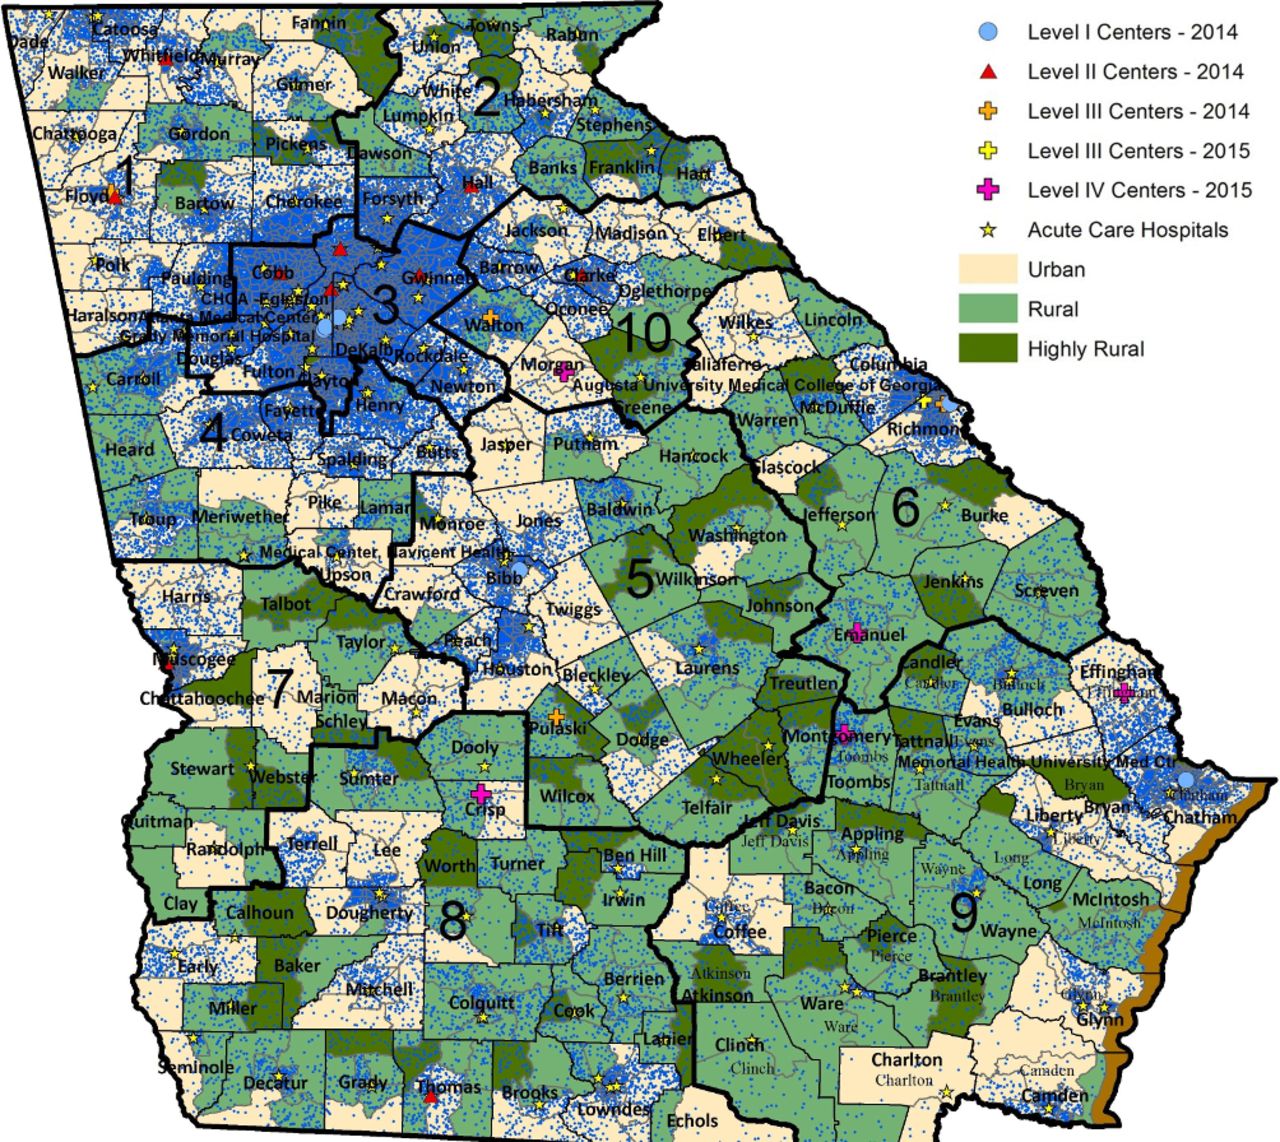
The Georgia trauma system includes 19 levels I to III DTCs (5 level I, 9 level II, and 5 level III). This is the number of trauma centers used in this analysis as the NBATS tool is designed to evaluate the number of levels I to III DTCs needed in a region. Georgia also has 5 level IV facilities, yielding a total of 24 DTCs, distributed among 10 EMS regions (figure 1). The EMS regions are referred to as TSAs in this analysis to match the terminology used in the NBATS tool description.

Distribution of Georgia trauma service areas and designated trauma centers with locations of trauma centers in neighboring states.
Results
The results of each of the six NBATS criteria are discussed below.
Population
The ACS NBATS tool assigned points based on the resident population of the TSAs. The points assigned ranged from 2 to 10 in this section. TSA 10, rural area, was assigned 2 points, whereas TSA 3, greater Atlanta metropolitan area, was assigned the highest number of points by this criterion. The population density associated with each TSA is illustrated in figure 2, where each blue dot represents 100 people.
Outline of trauma service areas with population density. Each blue dot represents 100 people.
Median transport times
Table 1 lists the median transport times in minutes for all at-risk patients transported to any acute care facility, level I or II trauma centers, and level I, II, or III trauma centers. The estimated median transport times for patients with a residence location inside the TSA from 2010 to 2014 were the most accurate reflection of the median transport times and were used for point assignment. No significant differences were found when level III trauma centers were added to the evaluation.
Median transportation times by TSA
Lead agency/system stakeholder/community support
Lead agency, system stakeholder, and community support are assumed for each TSA. All regions will be assigned a maximum of 5 points.
At-risk patients (ICISS<0.85) discharged from acute care facilities not designated as level I, II, or III trauma centers
Using the ICISS<0.85 definition of “at risk,” none of the TSAs had over 200 at-risk patients discharged from facilities not classified as a level I, II, or III trauma center. Therefore, no NBATS points were assigned (table 2).
Summary of assigned NBATS points
Verified level I, II, and III trauma centers
The fifth criterion deducts NBATS points for existing verified trauma centers in a TSA. The most recent allocation of trauma centers (2015) is used in the analysis since the objective of the NBATS tool is to aid policy makers in decisions regarding the future allocation of state trauma system resources. Based on the locations of the centers, the negative NBATS points assigned to each TSA are shown in table 2, ranging from 0 in TSA 4 to −5 in TSA 3.
Numbers of at-risk patients (ICISS<0.85) seen in trauma centers (level I and II) already in the TSA
In TSA 3 there are five level I and level II centers, yielding an expected number of high-ICISS patients of 2500. The difference between the expected number (2500) and the actual number (1652) is 848 patients, generating an NBATS point assignment of −2. Points assigned to each TSA are listed in table 2.
Summary of results
Table 2 provides a summary of the NBATS points assigned to each region for the six criteria, as well as the sum of the points. The column labeled “recommended number of trauma centers” shows the number of trauma centers suggested by a strict interpretation of the NBATS tool. Densely populated or urban areas tend to be associated with a higher number of existing centers compared with the NBATS recommendation. Other less densely populated TSAs are characterized by large rural expanses with a single urban core where a DTC is located.
Summary of results using an alternative measure of “At Risk”: ISS>15
Criteria 2, 4 and 6 are affected by the definition of an “at risk” patient. The main analysis used the ICISS methodology to determine which patients are defined as “at risk.” A cut-off of ICISS<0.85 was used to define an “at risk” patient. We have considerable experience with this methodology as it has been used in previous evaluations of our state trauma system. To determine how the conclusions of the report would be different if the ISS methodology was used, the affected parts of the analysis were repeated (table 3). For criterion 2, the only difference found was associated with TSA 6. Using the ICISS methodology, 2 NBATS points were assigned to region 6 based on the median transportation times. Under the ISS method, only 1 point was assigned. For criterion 4, which refers to “at risk” patients (ISS>15) discharged from non-trauma centers, the ISS methodology resulted in 1 and 3 additional points being assigned to TSAs 3 and 6. For criterion 6, which refers to the number of “at risk” patients (ISS>15 or ICISS<0.85) seen in level I and II trauma centers already in the TSA, the assigned NBATS points were identical regardless of the severity measure.
Summary of assigned NBATS points using ISS
When comparing the ICISS versus the ISS methodology, the ISS methodology suggested three DTCs for TSA 9, compared with two when the ICISS methodology was used. Overall, there was minimal difference in recommendations when the ICISS or ISS methodology was used.
Summary of assigned NBATS points in the absence of a trauma system
The above analysis was completed using our current trauma system with existing trauma centers. The analysis was repeated using the NBATS tool assuming the trauma system had no trauma centers. The results of this analysis are shown in table 4. In this model, the existing number of trauma centers matches the recommended number by the NBATS tool in TSAs 1 and 10. In TSAs 3 and 6, the existing number of centers exceeds the recommended number, and in TSAs 2, 4, 5, 7, 8, and 9 the existing number is below the recommended number.
Summary of assigned NBATS points in the absence of a trauma system
Discussion
The estimates from the NBATS tool exactly matched the existing level I, II, or III trauma centers in 2 of 10 TSAs. For three TSAs (1, 3 and 6), the existing number of centers exceeded the number recommended by the NBATS guidelines. Thus, in 5 of 10 TSAs the existing number of DTCs matches or exceeds the NBATS allocation.
A comparison of the NBATS recommended versus the existing number of centers does not reveal any clear correlates, with the possible exception of population density. TSA 3 (Atlanta) stands out as the most densely populated area with 870 people per square mile. The entire TSA 3 is classified as urban using the Rural-Urban Commuting Area Codes from the Rural Health Research Center.14 The number of existing centers (5) exceeds the NBATS recommended number (2) by a factor of 2.5. The NBATS tool appears to grossly underestimate the need for trauma centers in this urban area as most of the trauma centers are near maximum capacity with very little surge capability leading to significant time on diversion. During the study period, there was a threefold increase in saturation/diversion in region 3 (urban), which resulted in region 3 hospitals being saturated or on diversion 10% to 30% of the time. One reason for this discrepancy is that a significant number of severely injured patients residing in TSAs 1, 2, 4, and 10 received treatment from TSA 3 centers during the study period. TSA 4 has no trauma centers and transports all patients outside the service area. This makes it difficult for a tool such as NBATS to predict the needs for TSA 3 without incorporating data from TSA 4 or other regions. This may explain the disconnect between NBATS tool only recommending two trauma centers for the largest urban area of the state. It may be necessary to add another criterion to the tool that evaluates patients transported from nearby regions to resolve this issue.
The next most densely populated region is TSA 1 with 203 people per square mile. Similar to TSA 3, the number of existing centers exceeds the number recommended by the NBATS tool, although to a lesser extent.
The third most densely populated region is TSA 4 with 171 people per square mile. In contrast to TSAs 1 and 3, the NBATS tool recommended DTC allocation for TSA 4 exceeds the existing number, zero, by three. TSA 4 has both large urban (67%) and rural (33%) areas. The urban areas are mostly in the counties that border TSA 3. The vast majority of severely injured patients living in TSA 4 received inpatient services in a TSA 3 hospital. For TSA 4 severely injured residents who received treatment at a DTC, the median time was among the highest, surpassed only by TSA 2 and TSA 8 residents. The NBATS tool did correctly identify a major need in this area as there were no DTCs in TSA 4 resulting in long patient transport times.
Besides TSA 4, TSAs 2, 7, 8, and 9 have fewer centers than recommended by the NBATS point system. In all cases, the NBATS allocation was two, compared with one existing center. These TSAs have large rural areas with one relatively densely populated urban core area where the existing center is located. Although the NBATS tool appears to underestimate the need for trauma centers in large urban areas, it identifies areas of need in the rural regions.
A recent evaluation of our state using the ICISS scoring method showed similar results with the need for additional trauma centers in regions 2, 4, 8, and 9.5 15 Evaluation of the state using both these methods demonstrates similar results and have identified areas that have obvious needs. Although the tool may not be perfect at identifying the exact number of centers, it provides an excellent exercise for evaluating need. The tool, in its current form, should not be used as a stand-alone, definitive evaluation on the exact number of centers needed in all regions, but should be used as one component of evaluation, combined with other information from state agencies, to describe a global picture of the state-wide trauma system. We found individual criterion in the NBATS tool to be very helpful when combined with previous analytical evaluations of our state. One example was combining the long transport times in TSA 9 (NBATS tool) with the ICISS scoring (previously performed) to confirm that TSA 9 was underserved. A list of hospitals that would be good candidates for future trauma centers was also identified through this process. This type of analysis, based on data, can be powerful when approaching the state legislature for funding of additional trauma centers.
It is important to point out that there is no gold standard by which to compare the NBATS tool. We have compared it with our existing number of trauma centers, but there is no guarantee that our existing number is the correct number as it was not based on a specific analysis that led to the development of the system. Like other states, our system evolved over time. This is the difficulty involved with the development of a tool such as the NBATS.
Therefore, the NBATS analysis was repeated assuming there was no trauma system, that is, no trauma centers in the state (table 4). There was very little variation as 8 of 10 TSAs had the same NBATS recommendation when compared with the current trauma system. Thus, it appears that the tool performs relatively well in both models, existing trauma centers or absence of trauma centers in the system.
Both ICISS and ISS scoring were used in the NBATS analysis to determine if one yielded better results. There was exact correlation in 9 of 10 TSAs (tables 2 and 3). The ISS scoring method recommended three trauma centers in TSA 9, whereas the ICISS scoring method recommended two. There is only one existing trauma center in this rural area. Therefore, both methods appropriately identified an area of need.
Overall, we have demonstrated that the NBATS tool estimates are lower than the existing number of trauma centers in urban areas and higher in the rural areas. A recent evaluation of the California trauma system using the NBATS tool demonstrated similar findings as the NBATS estimates were 70% lower than the current state in urban areas and 90% higher than the current state in rural areas.16
The current analysis was not able to fully incorporate the influence of a neighboring DTC in adjacent states. However, a visual examination of the location of such DTCs (figure 1) suggests it is highly likely that Georgia at-risk patients are transported to receive inpatient trauma services in facilities located in Florida, South Carolina, Alabama, and Tennessee. We were able to gain access to the Florida inpatient data set, obtained from the state’s Agency for Health Care Administration, to examine the number of Georgia residents classified as trauma alerts in two neighboring DTCs in northeast and northcentral Florida. In 2014, the final year of our analysis, 57 and 70 Georgia residents were classified as trauma alerts, and subsequently transported to the DTC in, respectively, northeast and northcentral Florida. The data did not specify the Georgia patients’ county of residence, so a more detailed analysis of their transportation times was not possible. However, it is reasonable to assume most resided in border counties.
The utilization of inpatient trauma services across state and TSA borders is a serious deficiency in the NBATS methodology. This suggests a need for a more fluid definition of TSAs which are not tied to rigidly defined political borders. One possible solution is to use the US Census Bureau’s metropolitan statistical areas (MSAs) in conjunction with states’ TSAs. Whereas TSAs tend to be defined by rigid political borders, MSAs are based on an area’s population density and economic ties; the latter changes as populations migrate or expand. As an example, consider TSA 3 (figure 2) and the Atlanta-Sandy Springs-Roswell MSA. In addition to all the counties contained in TSA 3 with a population of approximately four million, the MSA covers almost six million people by incorporating the relatively highly densely populated counties to the north (eg, Forsyth and Cherokee in TSAs 1 and 2), west (Paulding in TSA 1), south (Coweta, Fayette, and Henry in TSA 4), and east (Barrow and Walton in TSA 10). One obvious drawback of using MSAs to define TSAs is the treatment of rural locales which would be neglected. Therefore, at the risk of sacrificing simplicity, a multipronged approach may be more appropriate. For example, NBATS points may be added/deducted where considering both population density and economic ties (ie, the MSA) and political borders (ie, the TSA).
There are several other limitations to this analysis. First, lead agency/system stakeholder/community support could not be assessed directly but was instead assumed. Thus, for each TSA a maximum of 5 points was assigned for this element. Second, because actual transportation times from the scene of an injury were not available in the data, they had to be estimated using patients’ residence zip code. Also, the mode of transportation could not be assessed from the data. Therefore, ground transportation was assumed for all patients. We think this is a reasonable assumption as less than 2% of the trauma patients are usually transported by air in Georgia on an annual basis. Finally, 1.2% of patients admitted to a DTC were transferred from another facility, including outpatient surgery centers. Because the proportion is relatively small and an important component of the methodology depends on the volume of patients, this cohort was maintained in the analysis. A subsequent sensitivity analysis did not reveal any noticeable changes to the results when transfer patients were omitted.
Conclusions
In conclusion, Georgia’s current distribution of level I, II, or III trauma centers matches or exceeds the NBATS recommended allocation for 5 of 10 TSAs. The tool appears to underestimate the number of centers needed in large densely populated areas but recommends additional centers in geographically expansive rural areas. The identified areas of need were similar to the ones identified in the previous gap analysis of our state using the ICISS methodology. It appears that the tool performs well in a model of existing trauma centers or in a system that assumes no trauma centers are present. The tool is a first step in assessing the need for state-wide inpatient trauma center services.
Acknowledgments
We thank Dr J Patrick O’Neal, Commissioner, Department of Public Health, the Office of Emergency Medical Services and Trauma, the Georgia Hospital Association, and the Georgia Trauma Care Network Commission for their dedication to trauma care in Georgia. Special thanks to Virginia Land for assisting with the preparation of this article.
Footnotes
Collaborators We are indebted to the members of the Georgia Research Institute for Trauma Study Group (GRIT) who provided invaluable assistance in the design of the study and data collection, including Amina Bhatia, MD, and Karen Hill, RN (Children’s Healthcare of Atlanta-Egleston); Peter Rhee, MD, and Elizabeth Atkins, RN, (Grady Health System); Dennis Ashley, MD, and Tracy Johns, RN, (Medical Center Navicent Health); James Dunne, MD, and Rochelle Armola, RN, (Memorial Health University Medical Center); Colville Ferdinand, MD, and Regina Medeiros, RN, (University Healthcare System); Amy Wyrzkowski, MD, and Jim Sargent, RN, (Wellstar Atlanta Medical Center); John Cascone, MD, and Daphne Stitely, RN, (Archbold Memorial Hospital); John Bleacher, MD, and Tracie Walton, RN, (Children’s Healthcare of Atlanta-Scottish Rite); Clarence McKemie, MD, and Melissa Parris, RN, (Floyd Medical Center); Romeo Massoud, MD, Jeffrey Nicholas, MD, and Gina Solomon, RN, (Gwinnett Medical Center); Steven Paynter, MD, and Kim Brown, RN, (Hamilton Medical Center); Scott Hannay, MD, and Leslie Baggett, RN, (Midtown Medical Center); Nathan Creel, MD, and Jesse Gibson, RN, (Northeast Georgia Medical Center); Thomas Hawk, MD, and Heather Morgan, RN, (Piedmont Athens Regional Medical Center); Barry Renz, MD, and Laura Garlow, RN, (WellStar Kennestone Hospital); Mark Gravlee, MD, and Aruna Mardhekar, RN, (WellStar North Fulton Hospital); Angelina Postoev, MD, and Melanie Cox, RN, (Clearview Regional Medical Center); Kelly Mayfield, MD, and Jaina Carnes, RN, (Redmond Regional Medical Center); Robert Campbell, MD, and Alex Jones, RN, (Taylor Regional Hospital); Robert Scheirer, MD, and Misty Mercer, RN, (Trinity Hospital of Augusta); Michael Thompson, MD, and Joni Napier, RN, (Crisp Regional Hospital); John Sy, DO, and Dana Shores, RN, (Effingham Health System); Brad Headley, MD, and Gail Thornton, RN, (Emanuel Medical Center); Michael Williams, MD, and Karrie Page, RN, (Meadows Regional Medical Center); Dennis Spencer, MD, and Michelle Benton, RN, (Morgan Memorial Hospital); Garland Martin, MD, and Michelle Murphy, RN,
(Appling Healthcare); Walter Ingram, MD, and Kelli Scott, RN, (Grady Burn Center); Fred Mullins, MD, and Farrah Parker, RN, (Joseph M Still Burn Center); J Patrick O’Neal, MD, and Renee Morgan, (Office of Emergency Medical Services and Trauma and the Georgia Trauma Care Network Commission).
Contributors DWA and EEP participated in study design, data collection, analysis and interpretation of data, drafting of the article, and critical revision. LEG, RSM, EVA, and TJJ participated in the analysis and interpretation of data and critical revision. CHF, JRD, and JMN participated in critical revision.
Funding The authors have not declared a specific grant for this research from any funding agency in the public, commercial or not-for-profit sectors.
Competing interests None declared.
Patient consent Not required.
Provenance and peer review Not commissioned; externally peer reviewed.