Article Text

Abstract
Background Non-fatal firearm injuries constitute approximately 70% of all firearm trauma injuries in the United States. Patterns of severity of these injuries are poorly understood. We analyzed the overall, age-, sex- and intent-specific temporal trends in the injury severity of firearm hospitalizations from 1993 to 2014.
Methods We assessed temporal trends in the severity of patients hospitalized for firearm using Nationwide Inpatient Sample (NIS) data over a 22 year period. Firearm hospitalization was identified using assault (E965x), unintentional (E922x), intentional self-harm (E955x), legal (E970) and undetermined (E985x) International Classification of Diseases, Ninth Revision, Clinical Modification (ICD9) codes. Injury severity was measured using the computed New Injury Severity Score (NISS). We used survey weighted means, SD and annual percent change (APC), and joinpoint regression to analyze temporal trends.
Results A weighted total of 648 662 inpatient admissions for firearm injury were analyzed. Firearm injury severity demonstrated a significant annual increase of 1.4% (95% CI=1.3 to 1.6), and was driven by annual increases among young adults (APC=1.4%, 95% CI=1.3 to 1.5), older adults (APC=1.5%, 95% CI=1.3 to 1.6), female (APC=1.5%, 95% CI=1.3 to 1.6) and male (APC=1.4%, 95% CI=1.3 to 1.6) hospitalizations. The annual increase among assault/legal injuries was 1.4% (95% CI=1.3 to 1.5), similar to unintentional (APC=1.4%, 95% CI=1.3 to 1.6), intentional self-harm (APC=1.5%, 95% CI=1.4 to 1.6) and undetermined (APC=1.4%, 95% CI=1.3 to 1.6).
Conclusions The severity of hospitalized firearm injuries increased significantly from 1993 to 2014. This annual increase reflects a move towards hospitalization of more serious injuries, and outpatient management of less serious injuries across the board, suggesting a mounting burden on the US healthcare system.
Level of evidence Level IV.
- injury severity
- injury
- time trends
This is an Open Access article distributed in accordance with the Creative Commons Attribution Non Commercial (CC BY-NC 4.0) license, which permits others to distribute, remix, adapt, build upon this work non-commercially, and license their derivative works on different terms, provided the original work is properly cited and the use is non-commercial. See: http://creativecommons.org/licenses/by-nc/4.0/
Statistics from Altmetric.com
Background
The majority of injuries related to traumatic injuries caused by firearms in the US result in non-fatal firearm hospitalizations.1 2 Roughly 30% of these people will die after being shot, about 30% are treated and discharged from hospital emergency departments, and the roughly 40% who remain sustain more severe injuries and are hospitalized for further treatment.3 4 Injury severity is often greater among firearm hospitalizations as compared with other traumatic injury hospitalizations.5 6
National data that have accumulated for over two decades may now permit new analyses and a new understanding of previously unreported, long-term trends and changes in firearm hospitalization.7 8 We broadly know that national firearm hospitalizations rates per 100 000 hospitalizations declined after the year 2000 and there has been little change in assault-related firearm hospitalizations in that same time period.8 9 We also know that there are substantial age-, gender- and intent-specific differences in firearm hospitalizations.3 8 10 Most firearm hospitalizations victims are male and most firearm hospitalizations are due to assault. Younger adults between the age of 16 and 45 years hospitalized for firearm injury were more likely to be injured by assault7 11 as compared with older adults who are hospitalized for self-inflicted injuries.12Older youth between 16–19 years of age had firearm injury profile similar to that of adults,13 particularly with respect to firearm homicide rates.
However, very little is known regarding the patterns of injury severity in firearm hospitalizations over time, and by age, sex and intent of injury subgroups. Therefore, the aim of this study was to analyze temporal trends in injury severity of firearm injury hospitalization over a multi-decade period. We also assessed the magnitude of firearm hospitalizations and compared the differences in temporal trends of injury severity across age, sex, and intent of injury subgroups.
Methods
Data source
We used inpatient hospitalization dataset, the Nationwide Inpatient Sample (NIS), Healthcare Cost and Utilization Project (HCUP), Agency for Healthcare Research and Quality from 1993 to 2014.14 The NIS data are nationally representative claims based data and contains information on hospital stays in 1000 hospitals sampled to represent a 20% stratified sample of US community hospitals from 47 states. Survey weights are provided to estimate weighted counts and estimates. Trend weights are provided for calculation of trends. We used trend weights for the analysis. Each year of the NIS provides information on approximately 9 million inpatients records.
Study design
This study used a subset of all firearm hospitalizations from NIS from 1993 to 2014 and we used a repeated cross-sectional study design to assess temporal trends of injury severity of firearm hospitalizations during this time period. Boston University School of Medicine Institutional Review Board approved the study.
Study cohort
The flow chart of data inclusion and exclusion is represented in online supplementary figure 1. There was a total of 789 782 871 weighted hospitalizations from 1993 to 2014. First, we excluded 524 270 hospitalizations, that were missing information on age, leading to remaining 789,258,601 hospitalizations. Second, we restricted in each year of NIS, those hospitalizations that had a secondary diagnosis International Classification of Diseases, Ninth Revision, Clinical Modification codes (ICD-9 CM) of assault (E9650, E9651, E9652, E9653, E9654), unintentional (E9220, E9221, E9222, E9223, E9224, E9228, E9229), intentional self-harm (E9550, E9551, E9552, E9553, E9554, E9556, E9559), legal (E970), war (E991) and undetermined (E9850, E9851, E9852, E9853, E9854, E9856) traumatic injuries. All injuries are captured as secondary diagnosis codes. For analytical purposes, we included legal under the assault category. Therefore, we excluded 788 535 952 non-firearm hospitalizations resulting in 722 649 firearm hospitalizations. We restricted the firearm hospitalizations to those admitted from ER, in attempt to use only those hospitalizations that are new events rather than a re-hospitalization due to a prior firearm injury. After excluding those hospitalizations admitted without a prior ER visit (n=73 987), the final weighted count of firearm hospitalizations was 648 662. Each record refers to a single hospitalization; as a result, a person may have multiple hospitalizations, and unique patient records may not be identified.
Supplementary file 1
Variables
We used Computed New Injury Severity Score (NISS) as a measure of overall injury severity on a continuous scale.15–17 NISS is a continuous variable measuring the firearm injury severity ranging from 0 to 75.16 Age groups used in the analysis were 0–15 (pediatric), 16–45 (young adult) and 46 and older (older adults) and sex into two groups of male and female. Intent of injury was categorized into assault (includes legal intervention), intentional self-harm, unintentional and undetermined.
The other patient variables we used were race/ethnicity, defined in NIS data as white (non-Hispanic white), black, Hispanic, other (includes Asian or Pacific Islander, Native American and others), and unknown (which have missing race/ethnicity data), type of insurance (private insurance/Medicare, self-pay, and Medicaid/no charge/other), median neighborhood income quartiles ($1–$24,999, $25,000–$34,999, $35,000–$44,999, $45 000 and above) and co-morbidities. Elixhauser comorbidity score was calculated from 29 co-morbidities identified based on ICD-9 CM codes.18 The hospital-level characteristics were location (rural and urban), teaching status (teaching and non-teaching), size of the hospital (small, medium and large) and US census regions (Northeast, Midwest, South and West).
Statistical analysis
First we used package ICDPIC Version 3.0 to calculate the new injury severity scores, NISS, for each firearm hospitalizations in each NIS data from 1993 to 2014.19 We used the primary scores of NISS for further analyses. Second, we used survey weighted multilevel mixed-effects generalized linear model (Gaussian family) with NISS as a linear dependent variable, year as a factor term and stratum as the random coefficient. We then obtained Bayesian shrinkage estimates as a way to decrease classification error of stratum, by shrinking the estimates towards the average estimated effect in each stratum.20 Third, we assessed the breakpoints and temporal changes in injury severity of firearm hospitalizations from 1993 to 2014 using Joinpoint Regression Programme version 4.5.0.1.21 Joinpoint regression is used to assess temporal trends by using an algorithm to test whether a segmented line is significantly better than a straight line. The regression is performed on a log scale and the points where the segments joint is called joinpoints or breakpoints. We used the predicted shrinkage Bayes estimates to calculate the annual mean, the log of the annual mean and the SE for Joinpoint analysis. For the Joinpoint analysis, the minimum number of observations from a joinpoint to either end of the data (excluding first or last joinpoint if it falls on an observation) was set 2. The number of points to place between adjacent observed x values in the grid search was set at 0. The number of joinpoints were set ranging from 0 to 4. The model selection method was based on permutation test, where the overall significance level was set at 0.05, and the number of randomly permuted data sets was 4499. Fourth, annual percent change (APC) was obtained for each segment along with 95% confidence intervals (95% CI). All P values were two-sided and significance level was <0.05. STATA MP 14.2 (StataCorp LP, College Station, Texas; 2009) was used for data analyses.
Results
Descriptive characteristics
Between 1993 and 2014, there were a weighted total of 648 662 inpatient admissions of firearm injury. The majority were of assaultive intent (389 506, 60.1%), followed by unintentional (n=157 225, 24.2%), intentional self-harm (55 601, 8.6%) and undetermined (46 330, 7.1%). Table 1 presents the overall demographic characteristics of firearm hospitalizations and by 4 year time periods. firearm hospitalizations were more likely to be between 16–45 years of age, black, men, reported to have either private or Medicare as private insurance, from low income neighborhoods. The characteristics of the hospitals where firearm injuries were treated were more likely to be urban, teaching, large and located in the south of the country. Each comorbidity by the same time periods are presented in online supplementary table 1.
Demographic and hospital characteristics of firearm injury hospitalizations, NIS 1993–2014
Distribution of firearm hospitalizations
Of the 648 662 firearm hospitalizations, 5.6% were among children, 82.3% among young adults and 12.1% among older adults. Across the years the proportion of those 0–15 year-old firearm hospitalizations ranged from 7.7% in 1993 to 3.7% in 2014, among 16–45 year-old firearm hospitalizations ranged from 84.6% to 78.7% and among >=46 year-old firearm hospitalizations ranged from 7.7% to 17.5%. The weighted stacked proportions of firearm hospitalizations across the years by age group are presented in online supplementary figure 2. The proportion of firearm hospitalizations that were male ranged from 88.6% in 1993 to 88.1% in 2014 and that were female ranged from 11.4% to 11.9% in the respective years. The weighted stacked proportions of firearm hospitalizations across the years by sex are presented in online supplementary figure 3. The weighted stacked proportions of firearm hospitalizations across the years by intent of injury are presented in online supplementary figure 4. Assault/legal firearm hospitalizations ranged from 55.6% to 58.9%, unintentional firearm hospitalizations from 30.6% to 26.0%, intentional self-harm firearm hospitalizations from 4.6% to 10.4% and undetermined from 9.1% to 4.6% in 1993 and 2014 respectively.
Computed New Injury Severity Score
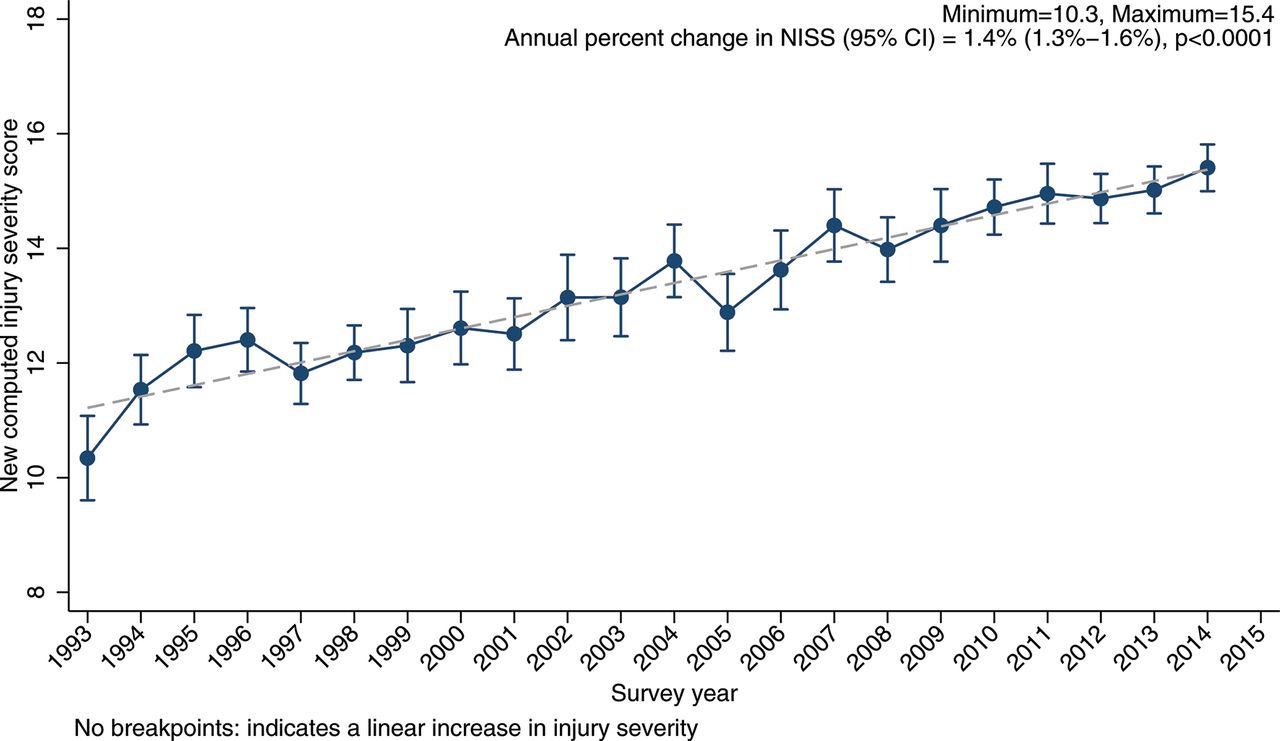
Online supplementary table 2 presents the annual mean and SE of overall NISS. The mean and SE in 1993 was 10.3 (0.4), increased to 15.4 (0.2) in 2014. Online supplementary table 3 presents the results of the Joinpoint analysis of overall NISS and by age group, sex, and by intent of injury. Figure 1 presents the temporal trends in predicted mean of overall NISS. There were no breakpoints, indicating a single segment from 1993 to 2014 with an increase (APC=1.4%, 95% CI=1.3% to 1.6%).

Temporal trends in predicted mean computed new injury severity score, NIS 1993–2014. Solid marker denotes the observed mean NISS with 95% CI. The dotted line is the predicted Bayes’ shrinked estimates using multilevel generalized linear model with Gaussian distribution.
Figure 2 presents the temporal trends in predicted mean of NISS by three age groups. Among children, there were two breakpoints at 1995 and 1998 and three segments: 1993–1995 (APC=9.2%, 95% CI=3.5% to 15.3%), 1995–1998 (APC=−0.9%, 95% CI=−6.0% to 4.5%) and 1998–2014 (APC=1.5%, 95% CI=1.4% to 1.7%). There were no breakpoints in young and older adults and each group demonstrated temporal increase in injury severity.

Temporal trends in predicted computed new injury severity score by age categories, NIS 1993–2014. Solid marker denotes the observed mean NISS with 95% CI. The dotted line is the predicted Bayes’ shrinked estimates using multilevel generalized linear model with Gaussian distribution.
Figure 3 presents the temporal trends in predicted mean of NISS by sex. There were no breakpoints among females or males, with a single segment from 1993 to 2014 and an increase in each group of 1.5% (95% CI=1.3% to 1.6%) and 1.4% (95% CI=1.3% to 1.6%) respectively.
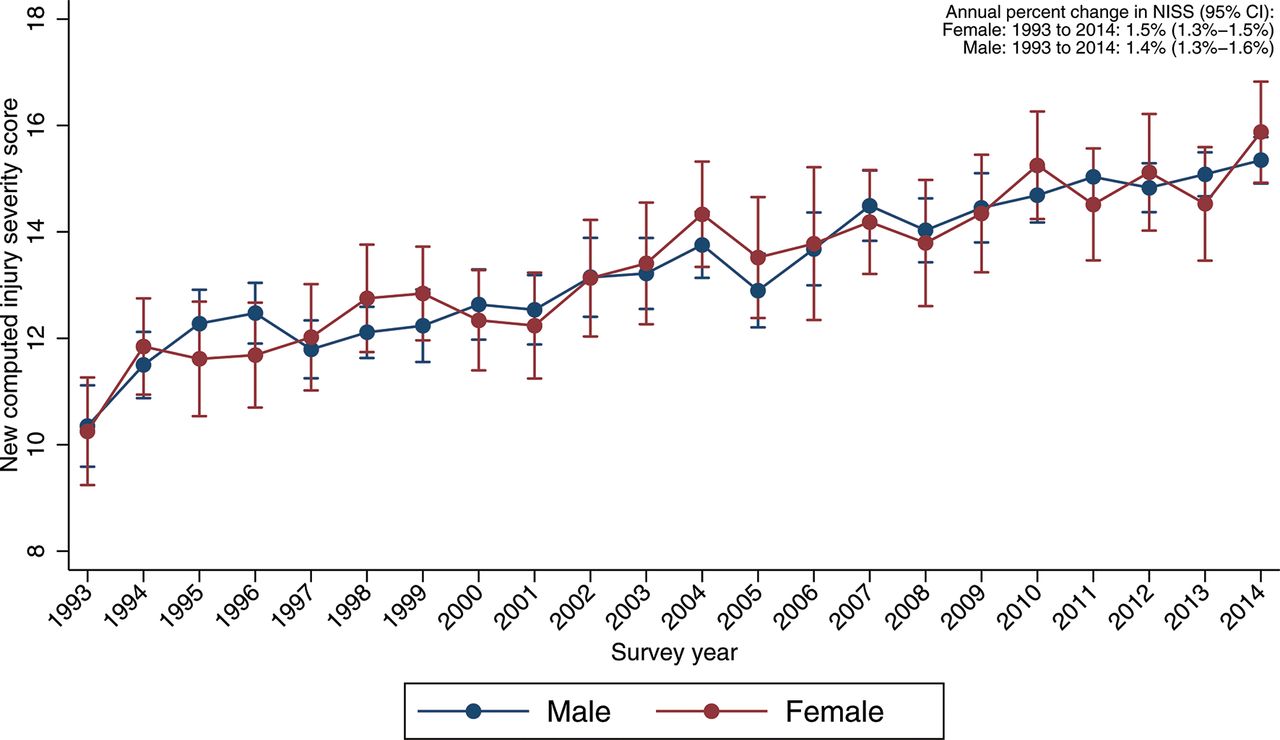
Temporal trends in predicted computed new injury severity score by sex, NIS 1993–2014. Solid marker denotes the observed mean NISS with 95% CI. The dotted line is the predicted Bayes’ shrinked estimates using multilevel generalized linear model with Gaussian distribution.
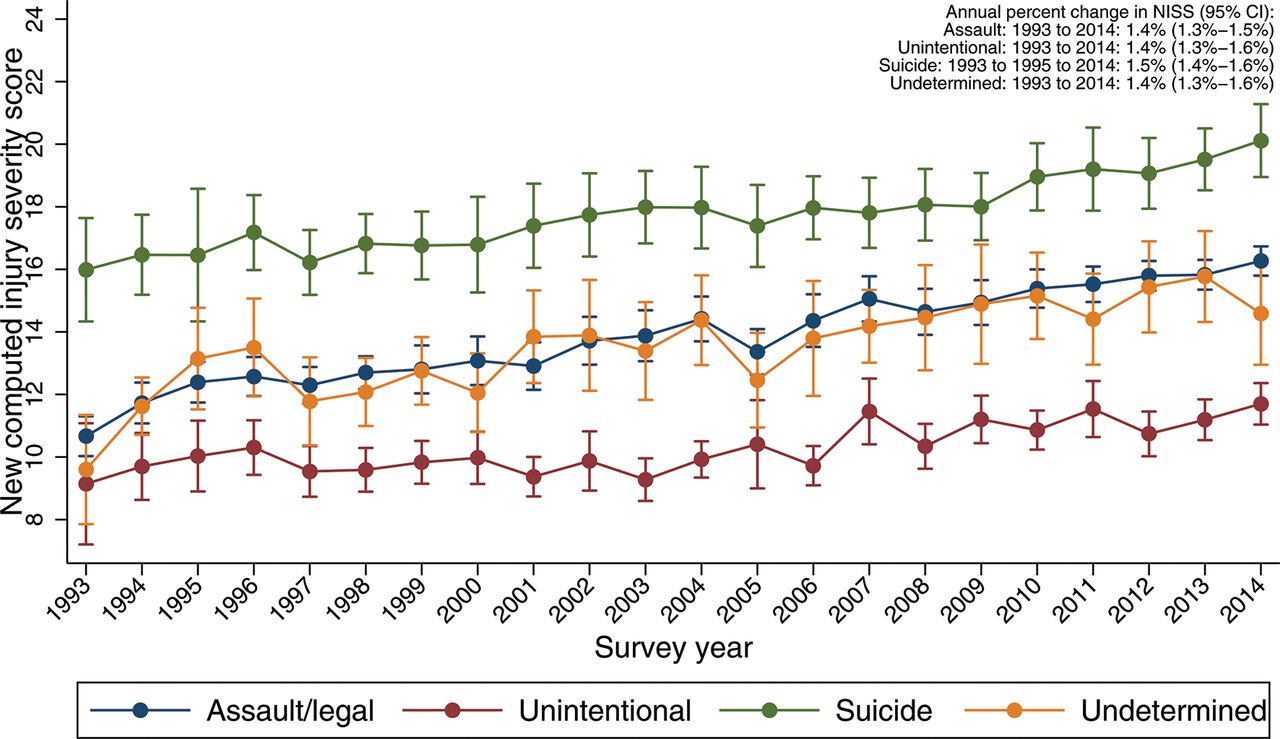
Figure 4 presents the temporal trends in predicted mean of NISS by intent of injury. There were no breakpoints in the four intent groups, with a single segment from 1993 to 2014. An increasing trend was observed in assault/legal (APC=1.4%, 95% CI=1.3% to 1.5%), unintentional (APC=1.4%, 95% CI=1.3% to 1.6%), intentional self-harm (APC=1.5%, 95% CI=1.4% to 1.6%) and undetermined (APC=1.4%, 95% CI=1.3% to 1.6%) firearm hospitalizations.
Temporal trends in predicted computed new injury severity score by intent, NIS 1993–2014. Solid marker denotes the observed mean NISS with 95% CI. The dotted line is the predicted Bayes’ shrinked estimates using multilevel generalized linear model with Gaussian distribution.
Discussion
Using nationally representative hospitalization data from 1993 to 2014 we found an overall increase in injury severity in firearm hospitalizations over time. There were two additional findings. First, both males and females and all types of intents of firearm injury demonstrated a comparable significant increase in national trends in firearm hospitalizations injury severity. Second, although the magnitude of injury severity was lower in children than adults, there were increasing temporal trends in injury severity from 1998 to 2014 among children as compared with a consistent increase among adults.
Our main finding of increasing severity of injury among firearm hospitalizations across years was concordant with a smaller study that assessed fatalities and severity of firearm injuries at one city trauma center from 2000 to 20134 and other studies that showed increasing injury severity among other forms of injury related hospitalizations over time.22–24 Another trauma center study reported a similar uptrend of severity in an urban pediatric population.25 The increase in firearm injury severity observed in our study is in concordance with an increase in length of stay reported using the same nationally representative hospitalization data in another study.26 Increasing lethality of civilian firearms, such as increase in the caliber of pistols may be another explanation in the observed increase in severity of firearm injuries.27 This finding is consequential in the context of an increasing national non-fatal firearm injury rate.2 Increasing severity of firearm injuries, potentially reflects both changes in firearm injury and in hospitalization patterns, may result in long term morbidity and disability, thereby increasing overall healthcare costs.
Our study also demonstrated comparable increasing trends among both men and women and in all intents of injury. However, we also found that the proportion of these subgroup firearm hospitalizations differed greatly. About 88% of firearm hospitalizations were male, which is similar to majority of studies that reported a similar proportion to be males.2 28 We found that majority of firearm hospitalizations were of assault and unintentional intent. Our finding of increasing injury severity during this study time period being driven by the increasing trends of injury severity among assault firearm hospitalizations is similar to a finding about firearm hospitalization attributed to assaultive firearm injuries in a study using national hospitalization data.8 Our findings are also in concordance with the overall increasing severity related to firearm injury and may be due both to better medical care that saves more lives, resulting in increasing severity of injuries in firearm hospitalizations,29 30 and injuries being better treated and discharged in the emergency room and trauma centers without being hospitalized.28 31 Intentional self-harm firearm hospitalizations have a slightly greater injury severity and may be explained by the results of a study that used data over 5 year period of gunshot to the brain that found an increasing survival rate from 10% to 46% with aggressive management,31 which is also indicative of the potential long-term physical and health consequences in the context of very severe injuries.
We report changes in temporal trends only among children with a large annual increase between 1993 and 1995, which then plateaued briefly between 1995 and 1998 and followed by a more steady but smaller annual increase from 1998 to 2014. The large increase may be indicative of acute care improvements in trauma centers.31 Our results are concordant with a retrospective review of assault in children admitted to trauma centers found that the risk of mortality was high among children, suggestive of an increased injury severity among children.32 Additionally, an analysis of emergency room visits found that firearm injuries increased 31.7% between 2006 and 2012,33 corroborating our results of increasing injury severity on subsequent hospitalization. The increase in such injuries in our study among young adults indicates the potential for prolonged disability and loss of productivity in young people.
Additionally, our investigation indicates that more than half of the firearm hospitalizations are assaultive firearm injuries corroborating other reports using hospitalization data and overall non-fatal data.2 8 Recent reports have reported that the increase in assault related non-fatal firearm injuries are an artifact of the Centers for Disease Control and Prevention’s (CDC) publicly available non-fatal data due to systematic error in misclassification of 40% of assault injuries as undetermined injuries from just two hospitals.34 35 Our results using firearm hospitalizations indicate the reverse, demonstrating an increasing proportion of assault-related firearm hospitalizations from 55.6% to 58.9% of all firearm hospitalizations along with a decline in undetermined injuries from 9.1% to 4.6% from 1993 to 2014. Therefore, our results remain in concordance with the reports using the publicly available CDC data.
Our results should be interpreted with caution due to some limitations. The central limitation is the lack of patient specific identifiers to identify index versus re-hospitalizations that is inherent in the design of such nationally representative claims based surveys that are exclusively based on hospitalizations alone. Firearm injury has a high risk of re-hospitalizations especially in patients with greater severity, which increases their likelihood of rehospitalizations.36 A second limitation is the lack of detailed integrated information regarding emergency department visits, where they were treated and released without hospitalization. Of all the non-fatal firearm injuries, about 40% are treated and released in the emergency department, while the rest are hospitalized. Improvement of trauma care and policies may have contributed to changes in hospitalization from emergency room treatment across the years. A third limitation is the missing race/ethnicity information that ranges between 31.2% to 5.2% from 1993 to 2014. That limits further exploration by race/ethnicity. The fourth limitation is that the enrolment of states was not similar across years; there were fewer states in earlier years. A final limitation is that the NISS, and the older injury severity score from which it evolved, have also potentially changed in usage and application over time, as has potentially the recording of anatomic injury information that is used to calculate these scores.37 Although the findings here may represent temporal trends in enhanced medical recorder skills, it is unlikely that this played a large role in what we found given the long-standing standardization of and education around the recording of injury and ICD data.
In conclusion, our data show growing injury severity among firearm hospitalizations over time. The increase in severity of firearm injury hospitalizations from 1993 to 2014 suggests an increasing healthcare burden related to firearm violence survivorship. This increasing challenge is primarily driven by assaultive intent particularly among young adults. It seems likely that these shifts reflect a move towards hospitalization of more serious injuries,22–25 and outpatient management of less serious injuries across the board.
References
Footnotes
This was presented at the APHA Annual Meeting and Expo —‘Creating the Healthiest Nation: Climate Changes Health’, Atlanta, GA, Nov 7, 2017.
BK and YZ contributed equally.
Contributors BK, YZ and SG conceived and supervised the study. YZ and BK completed the analyses. BK, YZ, ZX, MBS, JF, CB and SG led the writing and revisions of the manuscript. YZ assisted with obtaining data and performed data management.
Competing interests None declared.
Ethics approval Boston University IRB.
Provenance and peer review Not commissioned; externally peer reviewed.