Article Text

Abstract
Background Road traffic injuries (RTIs) are a cause of significant morbidity and mortality in low- and middle-income countries. Access to timely emergency services is needed to decrease the morbidity and mortality of RTIs and other traumatic injuries. Our objective was to describe the distribution of roadtrafficcrashes (RTCs) in Nairobi with the relative distance and travel times for victims of RTCs to health facilities with trauma surgical capabilities.
Methods RTCs in Nairobi County were recorded by the Ma3route app from May 2015 to October 2015 with latitude and longitude coordinates for each RTC extracted using geocoding. Health facility administrators were interviewed to determine surgical capacity of their facilities. RTCs and health facilities were plotted on maps using ArcGIS. Distances and travel times between RTCs and health facilities were determined using the Google Maps Distance Matrix API.
Results 89 percent (25/28) of health facilities meeting inclusion criteria were evaluated. Overall, health facilities were well equipped for trauma surgery with 96% meeting WHO Minimal Safety Criteria. 76 percent of facilities performed greater than 12 of three preselected ‘Bellweather Procedures’ shown to correlate with surgical capability. The average travel time and distance from RTCs to the nearest health facilities surveyed were 7 min and 3.4 km, respectively. This increased to 18 min and 9.6 km if all RTC victims were transported to Kenyatta National Hospital (KNH).
Conclusion Almost all hospitals surveyed in the present study have the ability to care for trauma patients. Treating patients directly at these facilities would decrease travel time compared with transfer to KNH. Nairobi County could benefit from formally coordinating the triage of trauma patients to more facilities to decrease travel time and potentially improve patient outcomes.
Level of evidence III
- global surgery
- trauma systems
- motor vehicle trauma
This is an Open Access article distributed in accordance with the Creative Commons Attribution Non Commercial (CC BY-NC 4.0) license, which permits others to distribute, remix, adapt, build upon this work non-commercially, and license their derivative works on different terms, provided the original work is properly cited and the use is non-commercial. See: http://creativecommons.org/licenses/by-nc/4.0/
Statistics from Altmetric.com
Introduction
Emergency medical services, including trauma surgical services, are an essential part of a highly functioning health system, especially in low- and middle-income countries (LMICs), where trauma kills more people than tuberculosis, malaria and HIV combined.1
Among traumatic events, road traffic injuries (RTIs) are a leading cause of morbidity and mortality in LMICs. They are the eighth most common cause of death overall and the leading cause of death in people 15–29 years old.2 3 Additionally, LMICs share a disproportionate burden of RTIs: 80% of RTI deaths occur in LMICs but only 53% of the world’s vehicles are registered there.4 In order to prevent these deaths, many reforms are needed, including improved road safety management, improved road design, improved vehicle safety, increased safe usage of roads, and faster access to definitive medical services.4
Kenya suffers from up to 8000 RTI-related deaths per year.4 RTIs were the second leading cause of traumatic injury in a community survey of Nairobi slums, the leading cause of death from trauma in Western Kenya, and, most recently, the leading cause of admission to the Kenyatta National Hospital (KNH) Accident and Emergency (A&E) department.5–7 Additionally, it has been shown that when matatus (semi-public ‘busses’ which ferry passengers between informal stops) are involved in RTIs, occupants commonly require hospital admission.8 Though there is a burgeoning emergency medical community, Kenya lacks a universal emergency medical services system. Most victims of RTIs are still transported to health facilities by ‘good Samaritans’ or family members.5 9 10
Recently, there has been an increased interest in using geographic information systems (GIS) techniques in understanding the relationship of populations to the availability and distribution of healthcare services, especially in a global surgical context. A macro-level study of nine countries showed that the proportion of a country’s population living within a 2-hour drive of essential surgical services varied from 17% (Somaliland) to 84% (Pakistan).11 Studies in Zambia12 and Ghana13 have attempted to use more granular mapping techniques to estimate countrywide access to surgical services and inform health systems planning. Of note, the Ghana study was able to identify five health facilities which were already providing some surgical services and had large catchment areas, making them ideal ‘targets’ for the expansion of their surgical services to increase timely access to care.14
Decreasing travel time to definitive surgical care is important for victims of traumatic injury. Multiple studies have shown that longer prehospital time results in increased mortality for trauma patients and that trauma patients in rural areas are less likely to survive hospitalization.15–17 Currently, most traumatic injuries in Nairobi are brought to KNH, the main public hospital, due to lack of insurance for most Nairobians.18
In the present study, we sought to understand the distribution of road traffic crashes (RTCs) in Nairobi and the relative distance and travel times for potential victims of RTCs to health facilities with trauma surgical capabilities. Specifically, we sought to evaluate the current ‘base case’ of all RTC victims seeking care at KNH to alternatives where RTC victims may be treated at alternative hospitals located around Nairobi. We believed that this would lead to a statistically and clinically significant decrease in travel time from the site of the RTC to definitive care.
Methods
Nairobi County houses the capital of Kenya with a population of 3.1 million people in ~700 km2 with a population density of 4515 persons per km2.19 Ma3route is a traffic reporting app that allows users to easily report RTCs with both text descriptions and pictures. They reach a reported 400 000 users per day.20 RTCs from Ma3route were collected between May 2015 and October 2015. RTCs were geocoded by matching descriptions of incidents to a custom database of landmarks in the Nairobi area to determine approximate latitude and longitude coordinates. RTCs were considered verified if they were reported more than once or if there was a picture of the RTC attached to the report. Verified RTCs in Nairobi County with complete latitude and longitude coordinates were included in the analysis.
Health facilities with a Kenya Essential Package for Health Level of IV or greater as reported in the Kenya Master Facility List were identified. This list was reviewed by local collaborators to ensure completeness; overlooked facilities were added. Facilities that currently provided emergency care to adults and had an inpatient ward were included. Latitude and longitude coordinates were determined for all facilities using both Google Maps and verification by global positioning system device by the study investigator.
Health facilities that were included in the study were surveyed using an instrument that included previously validated questions on WHO Minimal Safety Criteria, number of index procedures performed, and availability of equipment and staffing.12 13 The survey was initially piloted in a 10% sample of facilities and then administered to the remainder of facilities. There were no changes to the survey.
The GIS software mapping software ArcGIS (Esri, Redlands, California, USA) was used to plot the locations of both RTCs and health facilities in Nairobi to create a visual representation of the data. Maps were created in order to determine which facilities were closest to RTC ‘hot spots.’ Distances and travel times between each RTC and all health facilities identified were computed using the Google Maps Distance Matrix API (Google, Mountain View, California, USA), which accounted for traffic and time of day. Shortest travel time and distance from each RTC to health facilities were analyzed using Stata (Statacorp, College Station, Texas, USA). Descriptive statistics of RTC from the Ma3route data set and health facility surveys were computed. A kernel density plot of RTC time of day was created. Travel times and distances under multiple scenarios were computed.
Written consent was obtained from all participating health facilities.
Results
RTCs in the Ma3route data set
Overall, there were 986 RTCs reported in Nairobi County through the Ma3route app from May to October 2015. Of these, 69% reported information regarding vehicles involved. Police or an ambulance attended only 9.5% and 2.4% of the RTCs, respectively. Only 5.4% of RTCs were described as having ‘fatalities’ by the reporting individuals (table 1). Most of the reported RTCs occurred during morning and evening commute times (figure 1).

Kernel density plot of road traffic crashes (RTCs) by hour of day.
Road traffic crash characteristics for Ma3route data collected between May 2015 and October 2015 (n=982)
Health facility survey results
The Kenya Master Facility List and discussion with local experts yielded 28 facilities. Of these, 25 (89%) completed health facility surveys (table 2). The facilities were generally well equipped for safe surgery, with 24 out of 25 (96%) meeting all of the WHO Minimal Safety Criteria. Additionally, most were facile with the index procedures surveyed, with 76% performing greater than 12 of each index operation (exploratory laparotomy, open fracture repair, and cesarean section) each year. Very few facilities (20%) had 24 hours staffing by surgeons, obstetricians, and anesthetists. When facilities were stratified by type (faith based, private, or public), there were no clear differences in WHO Minimal Safety Criteria, index operation performance, or staffing.
Hospital staffing and operative capacity by facility type
There were no significant differences in equipment availability between facilities by facility type. However, all faith-based facilities had CT scanners, whereas some private and some public facilities did not. All facilities were well equipped with anesthesia equipment and sterile instruments. Fewer facilities across all groups had good availability of blood of all types (table 3).
Per cent availability of equipment by facility type
Geospatial analysis
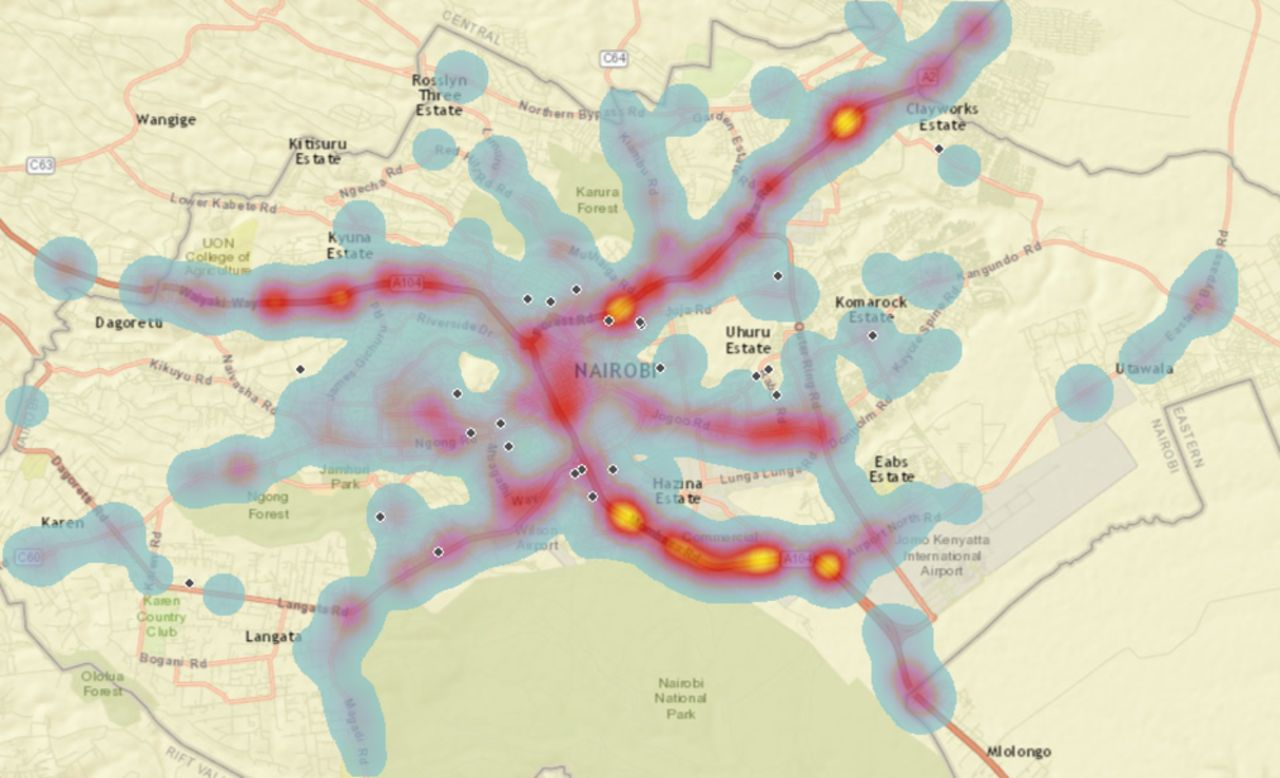
A map detailing the geospatial distribution of RTCs in Nairobi is shown in figure 2. The highest density of RTCs were on Thika Road east of the city, Waiyaki Road west of the city, and Mombasa Road south of the city. A full 44% of all RTCs recorded occurred on six major roadways. There appears to be a lower density of RTCs in the city center compared with transition zones between peri-urban and urban areas. For example, there were many RTCs reported where Thika Road transitions from a high-speed highway to an urban road.

Geospatial distribution of road traffic incidents and health facilities in Nairobi, Kenya.
Travel time and distance
The median travel time from the site of the RTC to a receiving hospital was 7 min if all hospitals were included (table 4). Due to its central importance in trauma systems in Nairobi, multiple scenarios involving KNH were compared. The median travel time increases to 18 min if only KNH is used as a receiving hospital for RTC patients. If trauma surgical services for all patients were expanded to the next optimally placed hospital included in our survey, the travel time would decrease to 14 min. It would further decrease to 11 min if including the next two optimally placed hospitals. The median travel distance is 3.4 km if all hospitals are included (table 5). If only KNH is used, the median distance to a facility is 9.6 km. This median distance decreases to 7.4 km if including the next optimally placed hospital and 6.8 km if including the two next optimally placed hospitals.
Travel time to health facility under different conditions
Distance to health facility under different conditions
Discussion
We found an acceptable density of health facilities with trauma surgical capabilities in Nairobi, Kenya, with all patients less than 1 hour away from definitive care.
Geospatial mapping, distance analysis, and travel time analysis confirm that there are many well-equipped health facilities that are positioned to receive trauma surgical patients.
In the present study, cars (39%) and busses (27%) were the most commonly reported vehicles involved in RTCs. A countrywide study found vehicle passengers were the most common victims of road traffic injuries accounting for about 50% of all RTIs.21
However, pedestrians had a higher rate of fatalities than any other group in both national and international studies.4 21 Though it is unclear if our data capture all pedestrian road traffic injuries as they may not cause significant traffic delays, our data does successfully identify the most incident RTC that causes injury.
Overall, the health facilities surveyed in the current study were well equipped. Compared with a previous study evaluating hospitals that cared for trauma patients across Kenya, there was greater availability of oxygen and anesthesia equipment.8 This increase in resources is likely due to our mix of facilities, large urban setting, and the fact that the majority of facilities surveyed were private. Supply of blood products was low across facilities of all types indicating a continued need to strengthen blood banking capabilities.
Unsurprisingly, both the distance and the travel time to the nearest health facilities in this urban setting were very low. However, these times were significantly higher when using only KNH as the destination for all RTI victims. We found that expanding access to a single additional, optimally placed, hospital would significantly decrease travel time from 18 to 14 min if expanding access to one hospital and to 11 min if expanding access to two hospitals. We believe these differences to be a gross underestimate in improvement given limitations in modeling traffic patterns on the Google Maps platform.
Additionally, data from Botchey et al actually showed much longer transport times from patients who presented to four hospitals in the Nairobi region, with a median time of 162 min. The authors cite the lack of coordinated prehospital care as a potential cause of the long prehospital time, as only 8.5% of patients arriving at KNH arrived by ambulance.5 This is in line with our findings of a relatively high density of health facilities in Nairobi. Lack of ambulance transport means that individuals would be even more susceptible to changes in traffic patterns as private vehicles do not have the right of way. Continued investment in a coordinated prehospital system may be useful. A new ‘ride hailing’ like system called Flare (similar to Uber or Lyft) may accelerate the ability of Nairobi to deploy emergency services more efficiently.22
There are definite limitations to our study. First, the ability of our road user reported data to capture all meaningful RTCs that cause injury is unknown. However, the data are concordant with some prior studies of road traffic injuries in Kenya.21 Additionally, we only used reported RTCs that could be verified by either multiple reports or upload of a picture to the Ma3route app. Though this likely decreased our sensitivity to detect all RTCs, it helped to ensure that our data were meaningful and likely captured more significant (ie, more morbid) RTCs. Our evaluation of health facility surgical capabilities relied entirely on reported responses, which may be subject to desirability bias. We attempted to minimize this bias by informing our respondents that the data would only be presented in aggregate. The Google Maps Distance Matrix API is not yet robust in its traffic predictions, especially around rush hour times, in Nairobi. Though we made every effort to account for traffic patterns in the travel time analysis, the data presented are still likely underestimates. Better adjustment for traffic patterns and corroboration with prospectively recorded travel times would allow more accurate travel time estimation.
The present study shows the feasibility of combining novel data from industry, government maintained data sets, and prospective data for the comprehensive evaluation of a multifaceted public health problem. Though data sources here are heterogeneous, they each add to our ability to evaluate the accessibility of trauma surgical services in Nairobi. As private industry plays an important and increasing role in both direct healthcare delivery and healthcare systems more broadly,23 future research should be open to diverse data sources to facilitate a more thorough understanding of these complex challenges.
Overall, Nairobi is well equipped to care for patients in traumatic RTIs. Continued thoughtful implementation of programs to expand access to care is needed to ensure that all patients are treated promptly after road traffic injuries. As Kenya seeks to define its ‘Kenya Policy on Emergency Medical Care’, which is currently undergoing final drafting, we believe that our findings are of great interest to policymakers. The data strongly argue for the utilization of existing resources in non-public facilities for the provision of emergency surgical care. By expanding access to definitive resuscitative procedures at non-public hospitals and more thoroughly coordinating care, Kenya has an opportunity to decrease morbidity and mortality from RTIs.
Acknowledgments
We would like to heartily thank Elizabeth Resor for the original Ma3route data set and for her help in the conceptualisation of this work. We would also like to thank Ma3route for allowing the use of their data. Finally, we would like to thank all of the hospital administrators who participated in the study.
Footnotes
Contributors BIS and AAW contributed to the design, implementation, analysis and writing of this project. GMW and CJ contributed to the design, implementation, analysis and writing of this research. JK contributed to the implementation and analysis of this research. JMM contributed to the design of this research and writing of this research. RAD contributed to the design, implementation and writing of this research.
Competing interests None declared.
Ethics approval The study was approved by both the University of California, San Francisco and KNH institutional review boards.
Provenance and peer review Not commissioned; externally peer reviewed.