Article Text

Abstract
Background Trauma centers are resource-intensive environments, and pediatric-specific personnel are often limited resources. Identifying the temporal patterns of pediatric traumas can help guide resource allocation strategies to optimize patient care.
Methods We conducted a retrospective, single-institution analysis of 575 injured patients less than 18 years old that triggered a trauma team activation (TTA). TTA volume according to time of day and day of the week was analyzed using a mixed Poisson regression model and monthly patterns were analyzed using an analysis of variance. Subset analyses were conducted for children and teenagers.
Results Across all days, the 6-hour time frame between 15:00 and 21:00 had significantly more activations than average, encompassing nearly half (47.2%) of all pediatric TTAs (p=0.01). Saturdays had significantly more activations than the daily average (Saturdays: 26.0/year, Other: 14.8/year, p<0.01). A pediatric TTA was 3.6 times more likely to occur between 15:00 and 21:00 on a Saturday than any other time. Volume of activation did not significantly differ by month (p=0.880).
Conclusion The volume of pediatric trauma activations varies significantly according to time of day and day of the week. These findings can direct or validate resource allocation strategies such as staffing physicians, nurses, and ancillary personnel according to TTA volume.
Type of study Retrospective cohort study.
Level of evidence Level III.
- pediatrics
- resource allocation
This is an open access article distributed in accordance with the Creative Commons Attribution Non Commercial (CC BY-NC 4.0) license, which permits others to distribute, remix, adapt, build upon this work non-commercially, and license their derivative works on different terms, provided the original work is properly cited, appropriate credit is given, any changes made indicated, and the use is non-commercial. See: http://creativecommons.org/licenses/by-nc/4.0/.
Statistics from Altmetric.com
Introduction
Injury is the leading cause of morbidity and mortality in children, resulting in more deaths than all other causes combined and 10 million emergency department (ED) visits in the USA annually.1 2 Pediatric injuries lead to potential life-years lost, long-term disability, stress and financial burden to family members, and cost the US healthcare system over $300 billion every year.1 Although pediatric trauma patients often require specialized care, there is considerable variability in pediatric-specific resource availability. For example, the percentage of children who live within 30 miles of a high-level pediatric trauma center ranges from 0% in some US states to more than 90% in others.3 Given the lack of dedicated pediatric trauma care in many communities and the variability of pediatric-specific resources across trauma centers, identifying the temporal patterns of pediatric trauma team activations (TTAs) can help optimize allocation of this scarce resource.
Trauma centers require around-the-clock staffing and extensive resource availability, accruing considerable costs to maintain an infrastructure capable of providing high-quality care to an injured child. TTAs use a large number of institutional resources, including the immediate mobilization of staff from many departments such as emergency, surgery, anesthesiology, pediatrics, intensive care, radiology, respiratory therapy, blood bank, laboratory, and hospital administration. Costs of maintaining this infrastructure are estimated at $2.8 billion annually.4 5 Understanding the temporal pattern of pediatric TTAs and admissions is vital in determining how to focus a hospital’s limited resources to provide consistent, high-quality patient care while containing costs.
While the types of injuries sustained by the pediatric trauma patient are well described, less is known about the timing of such injuries.1 That we are aware of, there is only one study describing time of day, day of the week, and monthly trends for all types of pediatric trauma admissions. In a large single-center study, Groh et al found that the highest rates of pediatric trauma occur between 18:00 and 01:00, on weekends, and from May to August.6 However, whether these temporal patterns are similar at other trauma centers is not known. A number of factors may affect TTA volume patterns, such as population size, climate, region, and proximity to other trauma centers. We investigated the temporal patterns of pediatric TTAs at Santa Barbara Cottage Hospital (SBCH), a level 1 trauma center serving 500 000 on California’s Central Coast.
Methods
After Institutional Review Board approval, we conducted a retrospective review of patient records maintained in our prospectively recorded trauma database at SBCH. SBCH is an academic regional referral center and an American College of Surgeons verified Adult Level 1 Trauma Center. It is the only level 1 trauma center within a 100-mile radius and is the designated Pediatric Trauma Center for Santa Barbara County.
We identified TTAs that involved patients less than 18 years old from January 2014 to December 2018. Tier 1 trauma activations are defined as the highest level activations requiring the immediate and full mobilization of the trauma team. Tier 2 trauma activations are defined as limited trauma team mobilization. Tier 3 activations are trauma service consultations for patients not meeting tier 1 or 2 criteria but who are found to have injuries after ED assessment. Patient age, sex, race, activation date and time, trauma tier level, injury type (blunt, penetrating, or burn), Injury Severity Score (ISS), and mechanism of injury (International Classification of Diseases Ninth Revision (ICD-9) and ICD-10 E-Codes) were collected. Patients without time of TTA recorded were excluded from analysis. Statistical analysis was performed using R V.3.5.1.7
Data for time of day and day of the week were analyzed using a mixed Poisson regression model. Time of day analysis was conducted by binning the 24-hour day into 3-hour intervals. A statistical significance threshold was set as a p value less than 0.05. An analysis of variance test was used to measure TTA volume differences between months. Subset analyses were conducted for children (0–12 years old) and teenagers (13–17 years old).
Results
During the 5-year study period 7084 TTAs occurred, 624 (8.8%) of which involved pediatric patients. Forty-nine patients were excluded because time of TTA was not recorded, leaving 575 patients for analysis. The median age was 11 years (IQR: 4–15) and 62% of patients were male. Injuries were primarily due to blunt mechanism (89%), followed by burns (6%) and penetrating trauma (5%). The majority (67%) of TTAs were tier 2 activations with a median ISS of 5 (IQR: 1–8), 26% were tier 3 activations (median ISS=4, IQR: 1–9), and 7% were tier 1 activations (median ISS=13, IQR: 5–25). Table 1 summarizes patient demographics, mechanism of injury, ISS, activation tier level, and disposition.
Patient demographics, injury types, and disposition (n=575)
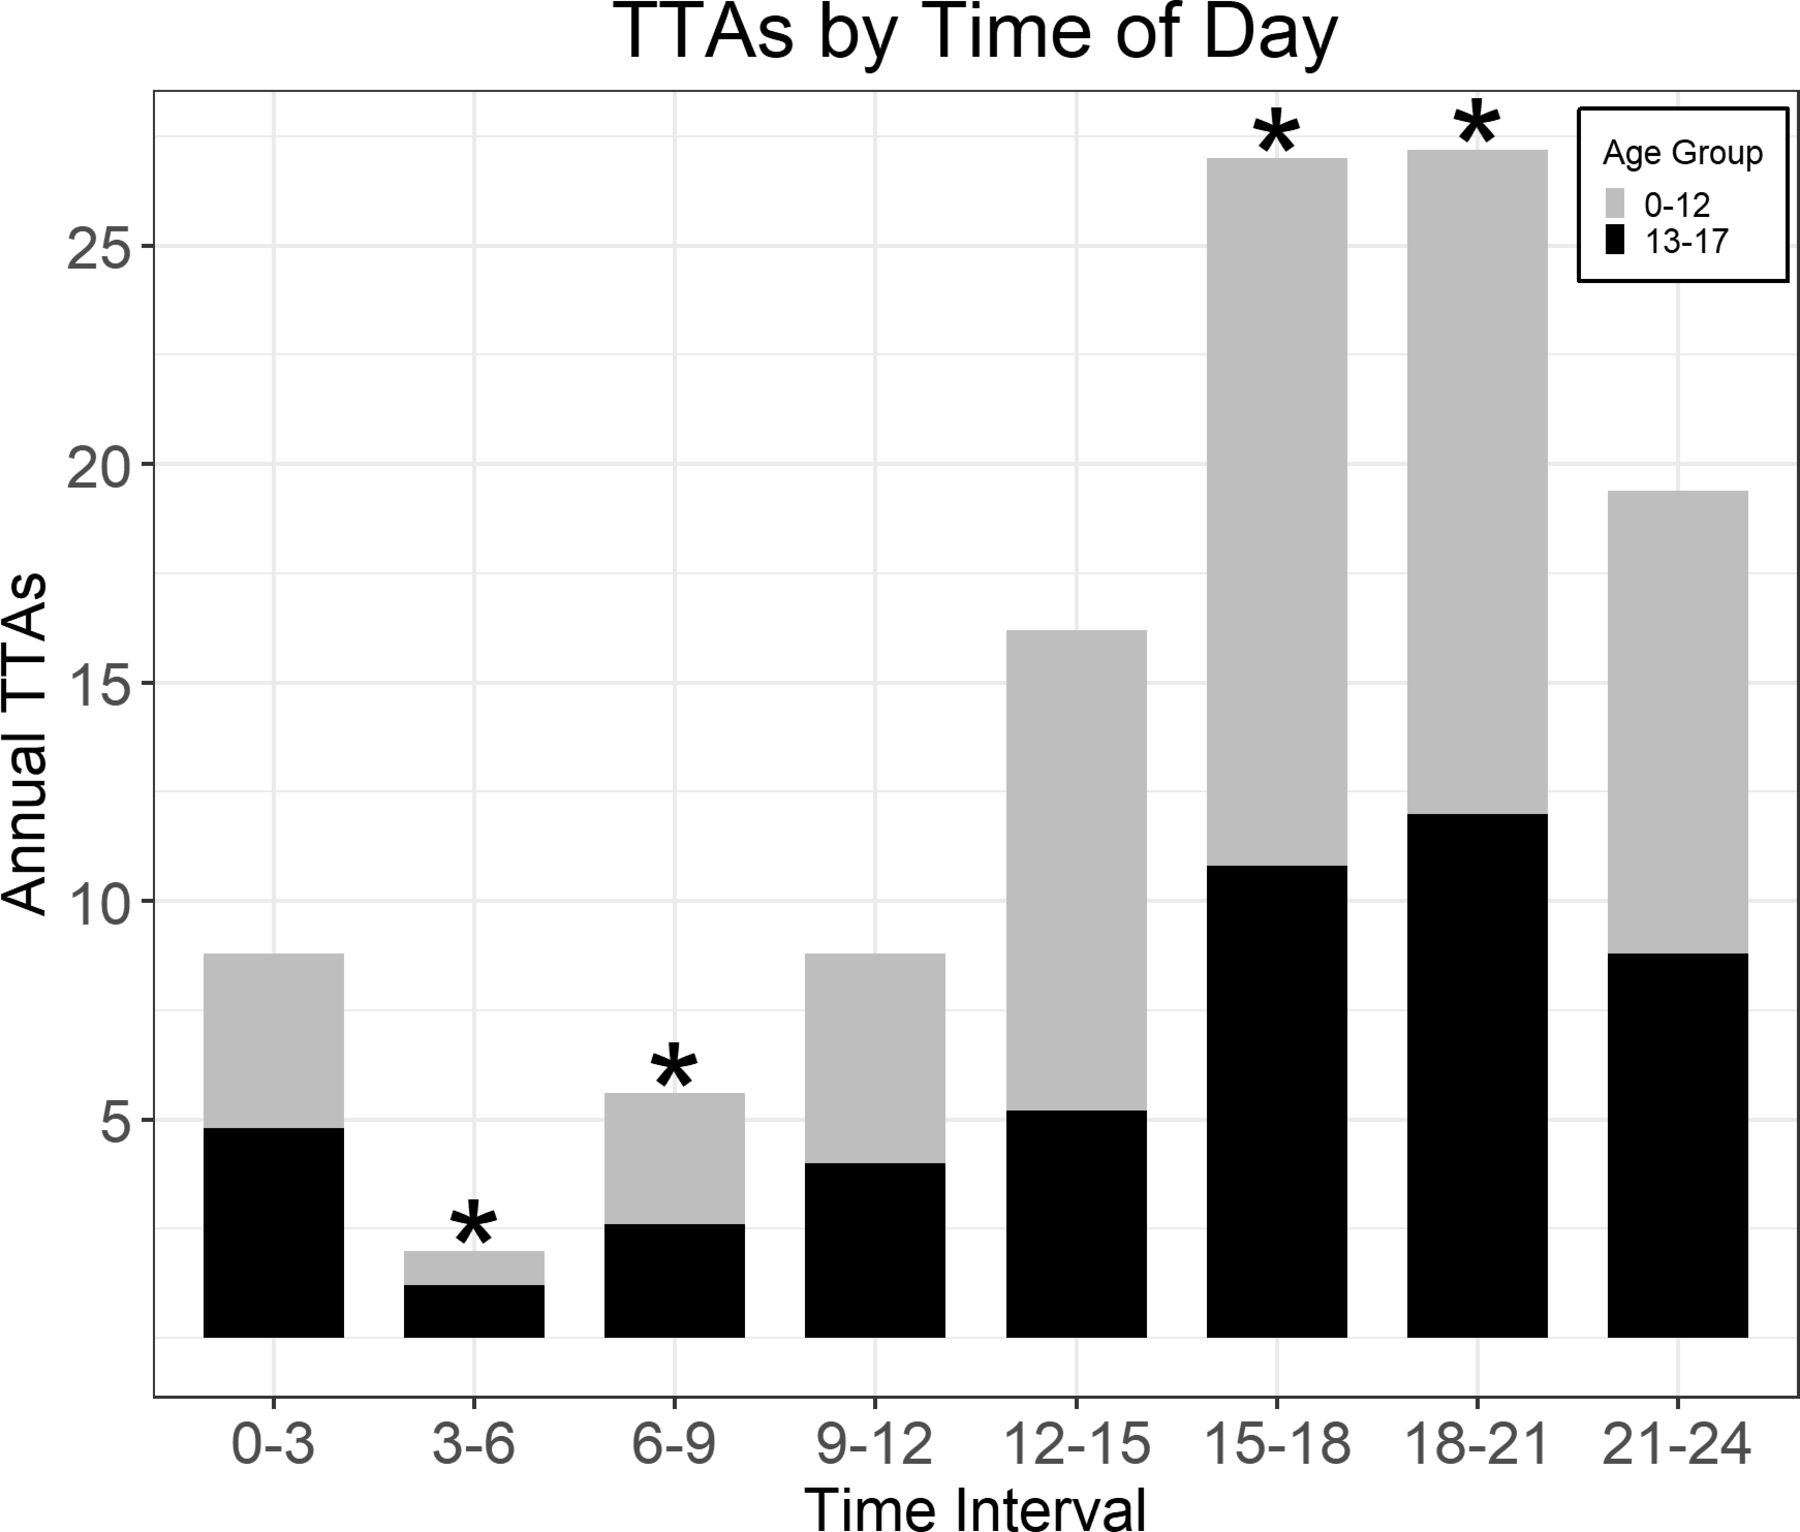
Saturdays had significantly more activations than the daily average (22.6%, 26.0/year, p<0.01) (figure 1). Across all days, the time periods from 15:00 to 18:00 (23.5%, 27.0/year) and 18:00–21:00 (23.7%, 27.2/year) had significantly more activations than average (p<0.01 and p=0.01, respectively); 03:00–06:00 (1.7%, 2.0/year) and 06:00–09:00 (4.9%, 5.6/year) had significantly less (p<0.01 and p=0.01, respectively) (figure 2). On Saturdays, children’s TTA volumes peaked between 15:00 and 18:00, in which 38.2% occur; whereas for teenagers, the peak time period was slightly later and less distinct (18:00–21:00, 27.4%) (figure 3A). The majority of Saturday TTAs occurred within a 9-hour window between 15:00 and 24:00 (75% for children and 62.9% for teenagers, figure 3A). For other days of the week, the peak time period was also between 15:00 and 21:00 for both groups, followed by 12:00–15:00 for children and 21:00–24:00 for teenagers (figure 3B). Overall, October had the highest number of activations (11.0/year), and the lowest number occurred in November (7.4/year), but seasonal rates did not significantly differ (p=0.880).
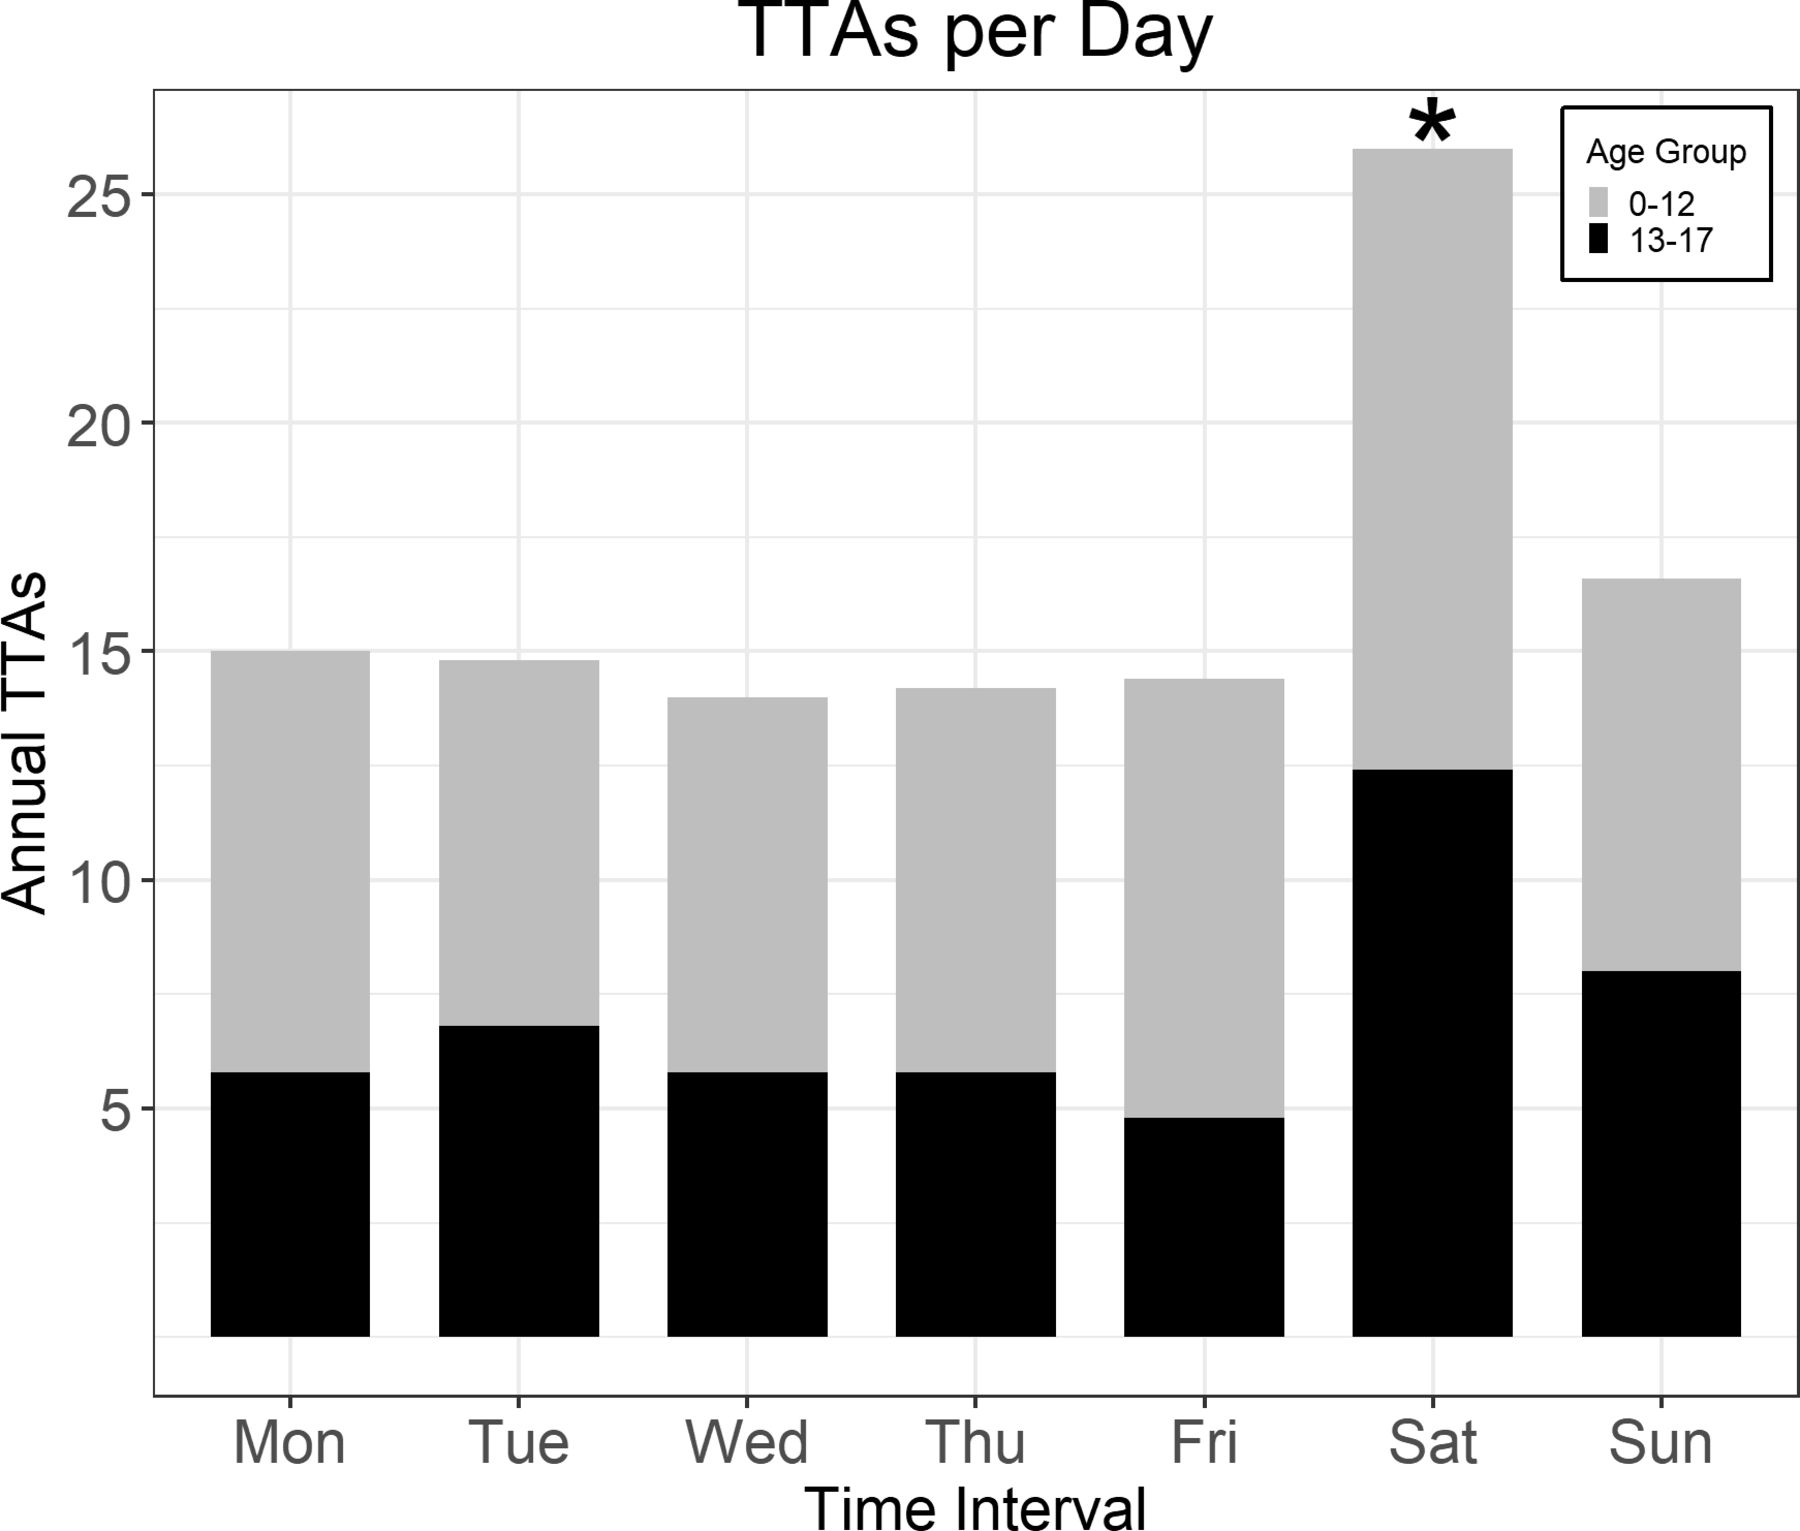
Mean number of activations by day. Saturdays had significantly more activations than any other day of the week (Saturday: 26.0/year, Other: 14.8/year, p<0.01). TTAs, trauma team activations.

Number of activations per 3-hour interval. 15:00–18:00 (27.0/year, p<0.01) and 18:00–21:00 (27.2/year, p<0.01) had significantly more activations than average. 03:00–06:00 (2.0/year, p<0.01) and 06:00–09:00 (5.6/year, p=0.011) had significantly less. TTAs, trauma team activations.

Trauma team activation (TTA) volume by time of day for children and teenagers on Saturdays (A) and all other days (B).
Discussion
Our study showed that pediatric traumas occur most often in the afternoon and evening hours between 15:00 and 21:00 at our institution. Over 47% of all pediatric TTAs happened during this 6-hour window, which coincides with the time frame between after school and bedtime. The vast majority of pediatric TTAs occurred on Saturdays, which is again associated with the times when children are active and out of school. Correspondingly, the highest rate of pediatric TTAs occurred on Saturdays between 15:00 and 21:00, when pediatric TTAs were 3.6 times more likely to occur than any other time period throughout the week. The lowest rate of pediatric trauma occurred in the early morning hours between 03:00 and 06:00, when most children are likely still asleep.
As the hourly and daily rates of pediatric TTAs were highest during times when children are active and out of school, by similar logic, we expected to find an increase during the summer months when school is in recess. Interestingly, and contrary to what we expected, we did not find a significant difference in monthly volume. October had the highest volume and November and December had the least, but these differences did not meet statistical significance. Prior studies have demonstrated a relationship between trauma volume and time of year, but this association seems to be mediated by temperature, with higher trauma admissions associated with higher temperatures.8–11 There are two possible explanations as to why we did not detect significant seasonal variation in our pediatric TTA volume. First, Santa Barbara County enjoys relatively mild seasons with minimal temperature fluctuations; the average monthly temperature varies by less than 7.2°C throughout the year.12 Seasonal changes may not impact our monthly patterns of pediatric trauma as much as centers located in other regions. Second, given only 5 years of registry data was used and the size of our trauma center, it is possible our study is underpowered to answer this question (type II statistical error), and that true differences in monthly trauma volumes exist. Further exploration using a larger data set might clarify this interesting finding.
Establishing and maintaining a trauma system requires a considerable commitment of staffing and resources. Understanding a hospital’s local temporal patterns of TTAs can aid in structuring local trauma system resources. In addition to ensuring adequate expert trauma and specialty practitioners, a trauma system must be able to reliably mobilize operative, laboratory, radiological, and social support services at all hours in response to trauma. An ideal resource utilization system would allow for dynamic upstaging of resources to match increases in demand, rapid downstaging as demand tapers, and built-in flexibility to accommodate surges when they occur unexpectedly. Additionally, it would allow for planned interruptions in critical hospital services to be scheduled during low trauma volume periods. Training sessions, major operative cases involving the pediatric trauma team, restocking, maintenance of laboratory and diagnostic equipment, and physical plant modifications can significantly disrupt normal trauma workflow and compromise trauma patient care, and would optimally be scheduled outside peak TTA time. One critical step in designing an intelligent trauma staffing model is first understanding the unique patterns of trauma patients’ ebb and flow at the individual hospital, which likely varies according to geography, climate, community served, and proximity to other trauma centers. This is particularly relevant for pediatric trauma victims, for whom resources may be scarce but at times in high demand, and so efficient allocation is paramount. Through our analysis, we were able to evaluate and subsequently validate our current staffing model for pediatric TTAs.
Our pediatric trauma staffing model has changed over time in response to expansions and contractions of available pediatric trauma specialists. In its current incarnation, all pediatric TTAs are staffed and managed by our already on-call adult trauma providers, and our pediatric trauma specialists are routinely engaged as consultants with their involvement being scaled to the degree of injury. This structure shifts the burden of the acute trauma response and management to a robust panel of adult trauma providers, protects our limited pediatric trauma panel, and engages them in an advisory capacity for our pediatric TTAs, the majority of whom are found to have only minor injuries. Given our relatively low number of pediatric traumas, this system buffers the response burden of pediatric TTAs, and allows us to have efficient pediatric trauma coverage with limited providers. As such, the impact of peak and non-peak periods is lessened on the pediatric trauma team, and minimizes the chances of exhausting this limited resource. However, this structure would not be appropriate for centers with higher pediatric TTA volumes in whom available depth of coverage allows for a dedicated and independent pediatric trauma team; the importance of this type of individualized trauma center analysis cannot be overstated when deciding how best to use the resources available to respond to injured patients. Though the granular details of our analysis may only be relevant to a limited number of high-level community trauma centers in temperate climates that have relatively low pediatric trauma burdens, how the analysis was done is applicable and relevant to any trauma system seeking to understand how best to deploy their limited pediatric-specific trauma resources.
This study has several important limitations. This was a retrospective review of a prospectively maintained trauma database and is vulnerable to coding and retrieval errors. SBCH is the designated Pediatric Trauma Center for the Santa Barbara County region, and though the majority of pediatric trauma in our area is referred to us, we were not able to capture those patients to whom referral was not offered, or those refusing transfer from remote hospitals; the impact these patients have on our understanding of pediatric trauma in our region is unknown. These data are a comprehensive review of the temporal patterns of pediatric trauma in our region, but whether these data are applicable to other regions is uncertain; analysis by other trauma systems of their own data is warranted and will allow for comparative studies.
Conclusion
Pediatric TTAs most often occur between 15:00 and 21:00, and on Saturdays at a level 1 community hospital serving 500 000 on California’s Central Coast. TTA volume was lowest during the early morning hours between 03:00 and 09:00. Intrahospital analysis of pediatric TTAs will help guide pediatric trauma resource utilization in a more focused and intelligent way.
Acknowledgments
Many thanks to Liliana Limon for her assistance in registry data extraction.
Footnotes
Contributors Study design: AJ, RK, SK, RS. Literature search: AJ, RS. Data collection: AJ, RS. Data analysis: AJ, RS, SK, RK. Writing: RS, AJ, RK, SK, JA. Critical revision: AJ, RS, JA, SK, RK.
Funding The authors have not declared a specific grant for this research from any funding agency in the public, commercial or not-for-profit sectors.
Competing interests None declared.
Patient consent for publication Not required.
Provenance and peer review Not commissioned; externally peer reviewed.
Data availability statement Data are available upon reasonable request.